Markets
10-Year Treasury Yield: Ripple Effects Across Markets, Policy & Capital Costs
How recent swings in the U.S. 10-year yield are reshaping borrowing, risk pricing, and the Fed’s dilemma
Recent Trajectory of the 10-Year Yield
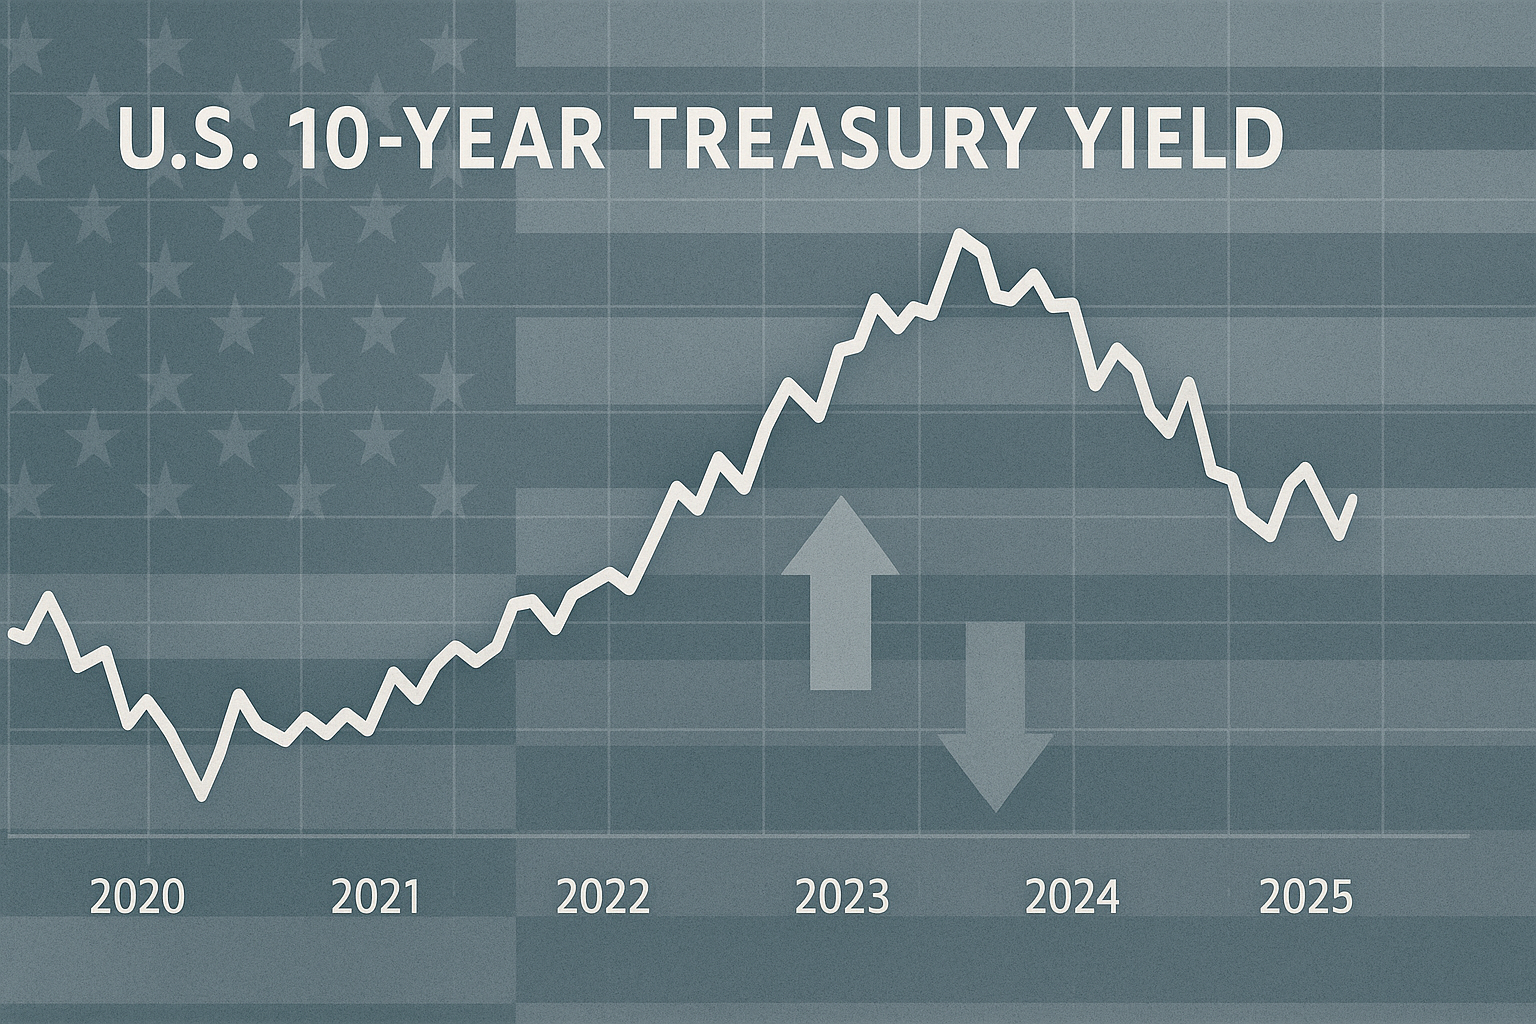
As of October 10, 2025, the 10-year U.S. Treasury yield closed at approximately 4.05%, marking a modest decline from the 4.10–4.20% range earlier in the year and below the midyear peaks near 4.5%.
Back in early June 2025, the yield hovered around 4.40%, according to the FRED series. This roughly 35-basis-point drop indicates some easing of long-term rate pressure. Still, yields remain well above pre-pandemic norms and significantly higher than the “neutral rate” estimates cited by many analysts.
The Federal Reserve’s H.15 release for October 10 confirmed that 10-year rates remain elevated among the broader spectrum of market rates. Meanwhile, the FOMC minutes from September 17, 2025, noted that “nominal Treasury yields fell 20 to 40 basis points over the intermeeting period,” particularly at shorter maturities—contributing to a mild steepening of the yield curve.
produto:The Art of X: Build a Business That Makes You $100/Day
Historical Context and Comparisons
Historically, the long-term average for the 10-year yield sits near 4.25%, though that benchmark fluctuates across cycles. The current yield remains slightly below that historical mean but well above the ultra-low levels of the 2010s, reflecting tighter global liquidity, persistent inflation, and elevated term premia.
Compared with 2024’s average yield of about 4.09%, the movement has been relatively stable. Yet from the early 2025 peak near 4.50%, the pullback suggests investors are pricing in a more dovish trajectory for the Federal Reserve.
---
Key Drivers of Recent Volatility
### Inflation Expectations and Term Premium Shifts
Longer-term yields embed both inflation expectations and a term premium compensating investors for duration risk. When inflation expectations rise, yields follow. Conversely, expectations of moderating inflation have recently contributed to lower yields.
### Fed Policy Expectations and Rate Guidance
Markets remain closely focused on the Fed’s rate path. In September 2025, the central bank cut the federal funds rate by 25 basis points to a 4.00–4.25% target range. Some investors interpreted the move as a prelude to further easing, anchoring long-term yields lower.
If inflation or labor data surprise to the upside, however, the Fed could pause or reverse course, prompting a yield rebound as markets reprice risk. The September FOMC minutes highlighted that the recent drop in short-term yields primarily reflected evolving policy expectations.
### Convexity and Portfolio Hedging Flows
According to Reuters reporting (March 2025), mortgage and bond portfolio managers’ convexity hedging can magnify yield movements when long rates fall, particularly as portfolios rebalance around key thresholds. These technical factors often intensify volatility during turning points.
### Fiscal Issuance, Supply Dynamics, and Treasury Operations
Heavy Treasury issuance can exert upward pressure on yields when investor demand softens. The FOMC minutes also noted that repo rates rose during the recent period due to increased coupon issuance and rebuilding of the Treasury General Account (TGA), underscoring the role of fiscal operations in market liquidity.
---
Transmission to Markets and the Cost of Capital
### Equities and Discount Rates
Higher long-term yields increase the discount rate applied to corporate earnings, pressuring valuations—especially for growth and tech stocks. When yields retreat, equity multiples tend to expand. The recent moderation in the 10-year yield may thus provide near-term support for equity markets.
### Credit Spreads and Corporate Borrowing
Corporate debt pricing is directly tied to the 10-year yield, the benchmark for long-term funding costs. If yields decline while credit spreads remain stable or narrow, corporate financing rates fall. However, heightened volatility in Treasury yields can widen risk premiums, offsetting those benefits. Tight credit spreads today suggest markets may be underestimating default risk.
### Housing, Mortgages, and Consumer Credit
Mortgage rates, particularly the 30-year fixed, move closely with the 10-year Treasury yield. A pullback in the benchmark yield typically lowers mortgage costs, improving housing affordability and refinancing conditions. Conversely, when yields rise, mortgage and consumer credit rates—such as for autos and personal loans—face upward pressure, tightening household finances.
---
Implications for U.S. Monetary Policy
### The Fed’s Reaction Function and Expectations
The Federal Reserve must determine whether long-term yield movements align with its inflation and growth objectives. Falling yields support a more dovish narrative, while an unexpected rise could reinforce inflation concerns and delay easing.
Fed officials have maintained a data-dependent stance. Philadelphia Fed President Anna Paulson recently emphasized that the central bank would respond “if inflation showed renewed momentum.” Futures markets currently price in potential rate cuts for October and December, though these expectations remain sensitive to yield curve dynamics.
### Yield Curve Signals and Recession Risk
The 10-year minus 2-year Treasury spread remains a closely watched recession indicator. A flattening or inversion—where short-term yields approach or exceed long-term ones—often signals expectations of an economic slowdown or policy overreach.
While the curve has not fully reinverted, ongoing volatility could push it into cautionary territory. Tracking the curve’s slope, alongside the Fed’s near-term policy adjustments, remains essential for assessing economic risk.
---
Macro and Financial Risks Ahead
### Inflation Surprises and Real Yields
If inflation exceeds expectations, real yields (nominal yields minus inflation) rise even if nominal rates stay flat—tightening financial conditions and dampening investment appetite. Conversely, if inflation falls faster than nominal yields, real rates also climb, unintentionally tightening the economy.
### Debt Servicing Burden and Fiscal Constraints
Elevated long-term yields increase the U.S. government’s interest expense on its debt stock. In a high-deficit environment, that dynamic amplifies fiscal stress and limits future policy flexibility. Higher refinancing costs can further crowd out discretionary spending, reinforcing the feedback loop between fiscal health and market rates.
### External Factors and Global Rate Spillovers
Global bond markets remain interconnected. Shifts in European or Japanese yields, or policy adjustments by foreign central banks, influence U.S. yields through capital flows and relative rate differentials. For instance, a sharp rise in European yields can attract global capital away from Treasuries, lifting U.S. yields. Conversely, safe-haven demand or global monetary easing can push them lower.
produto:The Art of X: Build a Business That Makes You $100/Day
Key Takeaways and What to Watch
- Next FOMC meeting: October 28–29, 2025 — critical for guidance on rate cuts.
- Inflation data: Upcoming CPI and PCE releases.
- Labor metrics: Employment and wage growth surprises.
- Fiscal calendar: Treasury issuance volume and auction demand.
- Credit spreads: Changes in corporate and high-yield benchmarks.
- Yield curve slopes: 10–2 and 10–30 differentials for policy signals.
- Hawkish Flip: Inflation rebound drives yields higher, forcing the Fed to pause or reverse easing.
- Steepening: Long yields fall faster than short rates, loosening financial conditions.
- Flattening or Inversion: Persistent short-rate pressure signals recession expectations.
- Volatility Regime: Technical or hedging flows amplify yield swings beyond fundamentals.
---
FAQ
Q1: Why does the 10-year Treasury yield matter so much for markets?
It serves as the foundational “risk-free” benchmark used to discount future earnings, price mortgages, and set borrowing costs. Shifts in the 10-year yield ripple through equity valuations, corporate credit spreads, and consumer lending rates.
Q2: Can the Fed directly control the 10-year yield?
Not directly. The Fed sets short-term policy rates and influences expectations via guidance and balance sheet policy. Long-term yields reflect market expectations of inflation, growth, and supply-demand conditions.
Q3: What does the shape of the yield curve signal about the economy?
When short-term yields rise above long-term yields, it often indicates that markets expect slower growth or eventual rate cuts—conditions that have historically preceded recessions.
Q4: What factors could cause long yields to reverse direction sharply?
Upside surprises in inflation or growth, fiscal stress, or global rate increases can push yields higher. Conversely, weak growth, strong safe-haven flows, or aggressive Fed easing expectations could drive them lower.
---
Sources and Further Reading
- Federal Reserve, FOMC Minutes, September 17, 2025.
- Federal Reserve, H.15 Selected Interest Rates, October 10, 2025.
- U.S. Treasury Department, Monthly Statement and Debt Issuance Data.
- Federal Reserve Bank of St. Louis, FRED 10-Year Treasury Constant Maturity Rate Series.
- Reuters, “Convexity Hedging Amplifies Bond Market Volatility,” March 2025.
- Bloomberg Economics, “Term Premium Dynamics in Post-Pandemic Markets,” 2025.
- Congressional Budget Office, “Federal Debt and Interest Costs Outlook,” 2025.