Crypto
Bitcoin Risks a Faster Drop if $75K Support Fails
The same trendline that rejected BTC at $94K is doing it again — now at $78K.
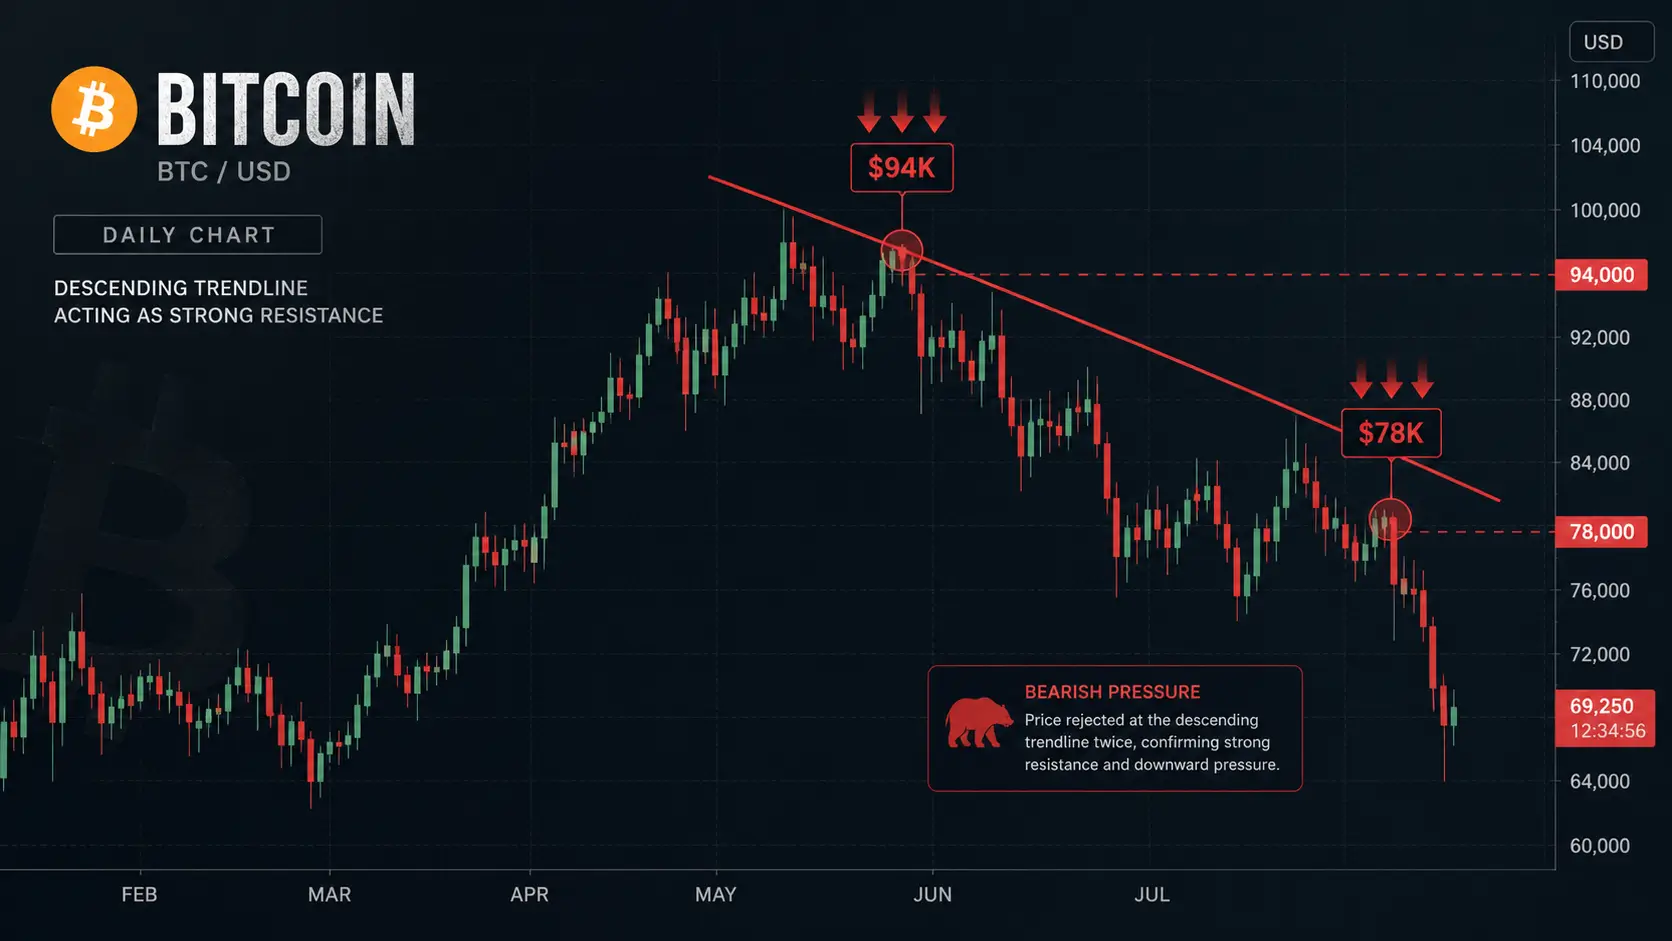
Bitcoin is stalling at a resistance line that has already won twice.
As of 04/25/2026, BTC trades near $77,500 — just below the Bear Market Resistance Band at $79,000, a trendline that halted the rally at $94,000 in October 2025 and is now capping the move again. Same line. Same result. Until Bitcoin closes above $82,000, this structure technically favors the bears.
The risk is immediate. A rejection here puts $74,500–$75,000 directly in focus — a zone where the next real buying test will happen.
---
ETF Flows Are Strong, But That's Not Enough Yet
Institutional demand is holding — and that's what's keeping this from collapsing.
U.S. spot Bitcoin ETFs pulled in $335 million on April 22 — the biggest daily inflow of the month — with BlackRock's IBIT absorbing 91% of all flows between April 13 and April 17. Monthly inflows reached $2.43 billion, turning year-to-date figures positive after a weak start in January and February.
But inflows alone don't break resistance. On-chain data shows a sharp increase in exchange deposits from larger holders as prices approach the mid-$70,000s — suggesting long-term holders are selling directly into ETF demand. Institutions are buying what veterans are distributing. That dynamic keeps price stable, but not moving.
---
What Happens Next Depends on Two Dates
The setup is binary — and the clock is ticking.
If Bitcoin fails to push past the $78,000–$79,000 zone with strong volume, a drop back to $74,500–$75,000 becomes likely. Below that, the next meaningful floor sits near $72,592 — a Fibonacci level that held during the April selloff. Losing both would open the path toward $65,000–$68,000.
The Federal Reserve's April 29 decision is the macro variable that could change everything. A dovish signal would reduce the rate uncertainty currently suppressing risk appetite. A hawkish hold would add pressure to a market already struggling to break through resistance.
ETF cumulative inflows now sit roughly $4 billion below their all-time peak — and at the current pace of $110 million per trading day, a single strong session could push the record over. That potential capital event is the bull case. The bear case is simpler: same line, third rejection.
---
Related Reading
→ Rate Cuts Risk Delay as Fed Signals Longer Hold
---
FAQ
Why does the $79,000 level matter so much right now?
It marks a long-term trendline that has rejected Bitcoin twice — first at $94,000 in October 2025 and again in April 2026. Repeated rejections at the same level signal genuine structural resistance, not noise.
Why aren't ETF inflows pushing Bitcoin higher?
Because large holders are selling into that demand. On-chain data shows increased exchange deposits from bigger wallets as prices rise — creating a supply/demand standoff rather than a breakout.
What triggers a faster drop below $75,000?
A combination of weak volume at current levels, a hawkish Fed signal on April 29, and continued distribution from large holders. All three are live risks right now.
What would confirm the bull case?
A daily close above $82,000 on strong volume, breaking the long-term downtrend line for the first time since the $126,000 peak.
---