Markets
What Drives Stock Market Cycles: A Complete Guide for Investors
Understanding how interest rates, earnings, sentiment, and global shocks shape the rhythm of markets in an era of persistent volatility
Financial markets rarely move in straight lines. Instead, they rise and fall in recognizable patterns shaped by economic growth, liquidity, and investor psychology. In early 2026, that cyclical nature is once again in focus. U.S. equities remain near historic highs, yet volatility has increased as inflation persists, interest-rate cuts appear less certain, and geopolitical tensions push energy prices higher.
The editorial framework provided in the briefing document underscores a central reality: market cycles are not random events. They emerge from a dynamic interaction between policy decisions, corporate performance, and human behavior. Understanding those forces is essential for investors navigating an environment where short-term pullbacks can occur even within long-term bull markets.
So what truly drives stock market cycles—and where might we be today?
---
What Is a Stock Market Cycle?
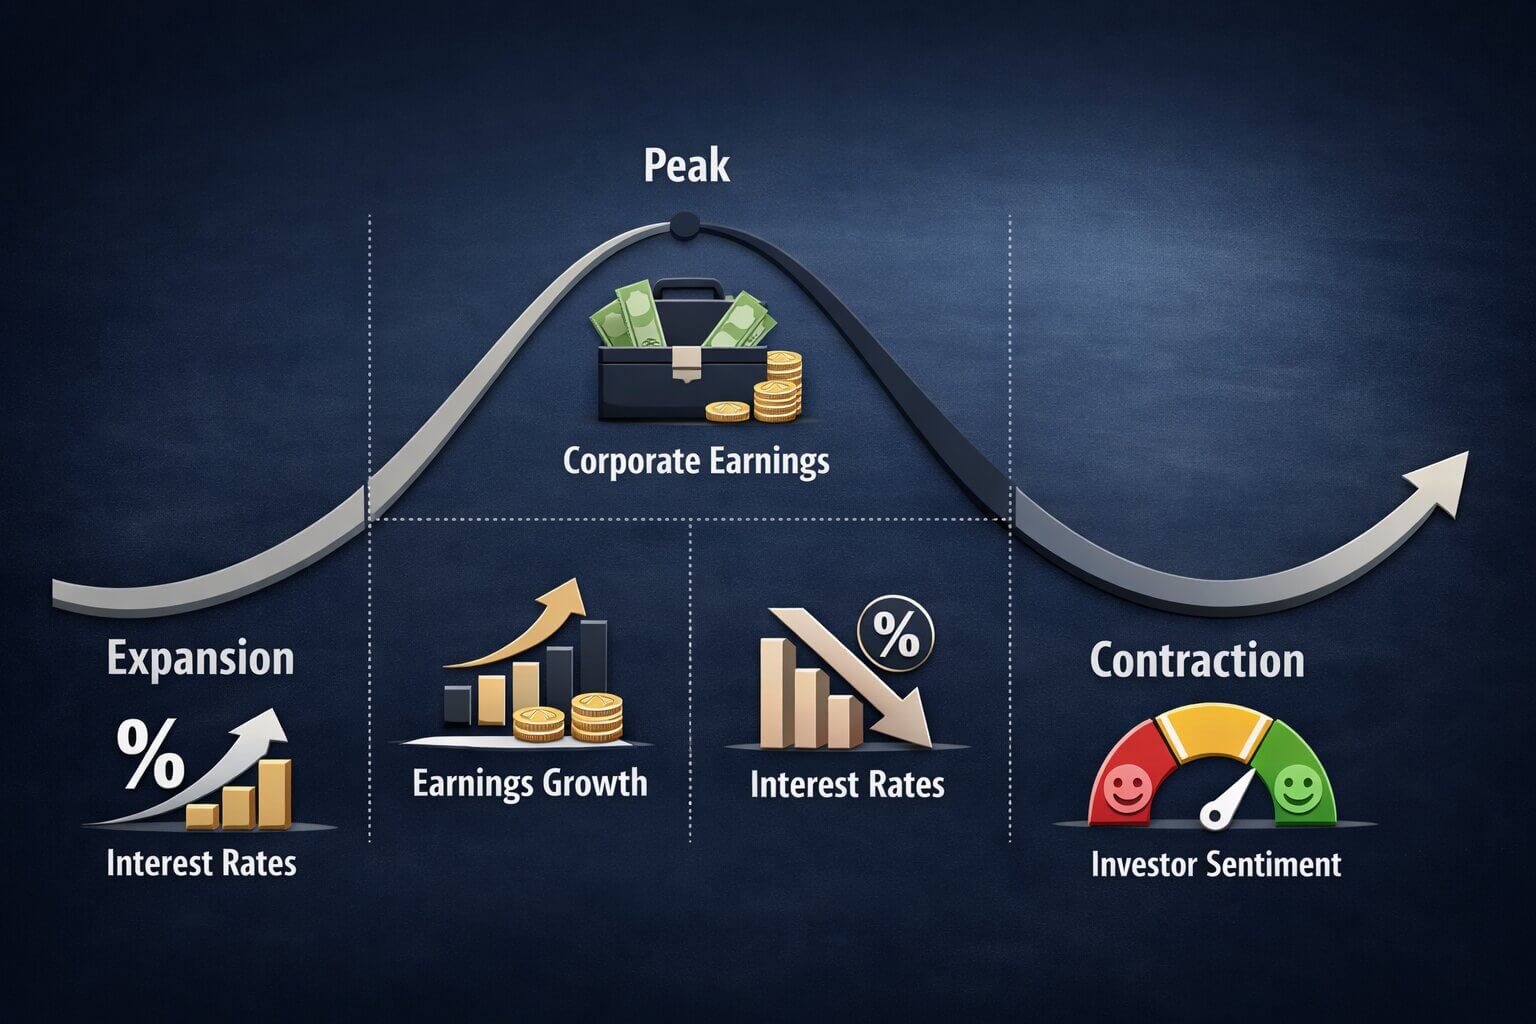
A stock market cycle refers to the recurring pattern of expansion, peak, contraction, and recovery in asset prices over time. These cycles are closely linked to economic activity, interest rates, and corporate earnings.
Historically, U.S. markets have demonstrated remarkable consistency in their long-term trajectory. Since 1928, the S&P 500 has delivered an average annual return of roughly 10% when dividends are included. Yet that return has been punctuated by frequent corrections and periodic bear markets.
Typical Duration of Market Phases
- Average bull market: Approximately 5.5 years
- Average bear market: Roughly 9 to 10 months
- Market corrections: Occur about once every 1 to 2 years
- Recessions: Historically appear every 6 to 10 years
These figures highlight a key insight: volatility is not an anomaly—it is a structural feature of markets.
---
The Four Phases of a Typical Market Cycle
Expansion (Early Bull Market)
This phase begins after a recession or significant market decline. Economic growth resumes, corporate earnings recover, and central banks often maintain accommodative monetary policy.
Key characteristics include:
- Rising employment
- Improving consumer spending
- Increasing corporate profits
- Low or declining interest rates
Historically, early-cycle markets deliver some of the strongest returns because valuations are relatively low and optimism begins to rebuild.
Peak (Late Bull Market)
During the peak phase, growth remains strong but begins to slow. Inflation pressures often emerge, prompting central banks to tighten monetary policy.
Common signals include:
- Elevated stock valuations
- Rising interest rates
- Strong but decelerating earnings growth
- Increased market volatility
In early 2026, many analysts believe U.S. equities are operating in this late-cycle environment, characterized by high valuations and persistent inflation.
Contraction (Bear Market)
The contraction phase typically follows aggressive monetary tightening or a major economic shock. Corporate earnings decline, unemployment rises, and investor sentiment deteriorates.
Key features:
- Falling stock prices
- Slowing economic growth
- Rising unemployment
- Reduced corporate investment
Bear markets often feel abrupt and unpredictable, but they are usually preceded by tightening financial conditions.
Recovery (New Cycle Begins)
Recovery marks the transition back to growth. Central banks begin easing policy, businesses rebuild inventories, and consumer confidence improves.
This phase often begins before economic data fully recovers—one reason markets frequently rebound ahead of the broader economy.
---
The Role of Interest Rates and Monetary Policy
Few forces influence stock market cycles more directly than monetary policy. Interest rates determine borrowing costs, corporate investment, and the valuation of financial assets.
On 03/18/2026, the Federal Reserve held its benchmark interest rate steady in a range between 5.25% and 5.50% (ET), signaling that inflation remained above target and that rate cuts would likely be limited in the near term.
That decision had immediate market implications.
How Rate Changes Affect Stocks
Rate hikes typically:
- Increase borrowing costs
- Reduce corporate investment
- Lower equity valuations
Rate cuts generally:
- Stimulate economic activity
- Increase liquidity
- Support higher stock prices
The relationship between bond yields and equities is particularly important. When the yield on the 10-year U.S. Treasury rises—as it did to roughly 4.2% on 03/21/2026 (ET)—stocks face greater competition from fixed-income investments.
From an investor perspective, the message is clear: liquidity drives cycles.
---
Corporate Earnings: The Fundamental Engine of Market Cycles
While interest rates influence short-term movements, corporate earnings determine long-term market direction.
Stock prices ultimately reflect expectations about future profits. When earnings grow, markets tend to rise. When profits decline, markets usually fall.
Earnings Trends in 2026
As of early 2026:
- S&P 500 earnings growth expectations remain positive but moderating
- Profit margins are under pressure from higher labor and financing costs
- Technology and artificial intelligence sectors continue to lead investment spending
These trends illustrate a critical dynamic: sector leadership often shifts during different phases of the cycle. For example:
- Early cycle: Industrials and consumer discretionary
- Mid cycle: Technology and financials
- Late cycle: Energy and defensive sectors
Understanding those rotations can help investors identify where the market may be heading next.
---
Investor Psychology and Market Sentiment
Markets are not driven solely by data—they are driven by people.
Fear and greed play a powerful role in shaping price movements. Behavioral finance research shows that investors often overreact to short-term news, amplifying volatility during both rallies and downturns.
Sentiment Indicators to Watch
- Volatility Index (VIX)
- Consumer confidence surveys
- Investor positioning data
- Market breadth indicators
In early 2026, volatility has increased as investors reassess expectations for interest-rate cuts and global growth. This shift in sentiment reflects a classic late-cycle pattern: optimism gives way to caution.
---
External Shocks That Trigger Cycle Turning Points
Market cycles can unfold gradually—but turning points are often triggered by sudden events.
These shocks typically include:
- Geopolitical conflicts
- Energy price spikes
- Financial crises
- Policy changes
For example:
- The global financial crisis of 2008 triggered a severe bear market
- The COVID-19 pandemic in 2020 caused one of the fastest market declines in history
- Recent tensions in the Middle East have pushed oil prices higher, increasing inflation risks
Such events rarely create cycles on their own. Instead, they accelerate trends already underway.
---
Structural Drivers Shaping Modern Market Cycles
Today’s market cycles are increasingly influenced by long-term structural forces that extend beyond traditional economic indicators.
Artificial Intelligence Investment
Capital spending on artificial intelligence infrastructure has surged in recent years, supporting productivity growth and corporate profitability.
Technology investment cycles often create extended periods of market expansion, similar to the internet boom of the 1990s.
Energy Demand and Infrastructure
Global energy consumption continues to rise, particularly in emerging markets. At the same time, the transition to renewable energy requires massive investment in power grids and storage systems.
These trends can sustain economic growth even during periods of monetary tightening.
Geopolitical Realignment
Supply chain diversification and regional trade alliances are reshaping global commerce. This shift is increasing costs in the short term but may enhance resilience over the long run.
The implication for investors is significant: structural trends can prolong cycles and alter traditional patterns.
---
How Investors Can Identify Where We Are in the Cycle
Recognizing the current phase of the market cycle requires monitoring a combination of economic and financial indicators.
Key Signals to Watch
Economic Indicators
- GDP growth rate
- Inflation rate
- Unemployment rate
As of 02/2026 (ET):
- U.S. unemployment rate: approximately 3.9%
- Inflation rate: around 3.1% year over year
These figures suggest continued economic expansion, though growth is moderating.
Financial Indicators
- Yield curve shape
- Credit spreads
- Stock market valuations
An inverted yield curve—when short-term interest rates exceed long-term rates—has historically preceded recessions. While not a perfect predictor, it remains one of the most closely watched signals.
---
Why Market Cycles Still Matter in the Long Run
Market cycles can feel disruptive in the short term, but they are essential to long-term growth.
Every major market downturn in modern history has eventually been followed by recovery. The average time for stocks to recover from a correction is typically less than one year, while recoveries from bear markets often take two to four years.
This pattern reinforces a core investment principle: discipline matters more than timing.
The Investor’s Takeaway
Cycles are not signs of failure—they are mechanisms of adjustment. They allow markets to reset valuations, reallocate capital, and prepare for the next phase of growth.
In early 2026, the U.S. economy remains resilient, but uncertainty has increased. Inflation, interest rates, and geopolitical tensions are testing investor confidence. Yet the long-term drivers of growth—innovation, productivity, and capital investment—remain intact.
For investors, the challenge is not to predict every market move, but to understand the forces shaping the cycle and respond with patience and strategy.
From an AlphaPulse perspective, the lesson is straightforward: volatility is inevitable, but informed decision-making is a competitive advantage.
---
FAQ — Stock Market Cycles
What causes stock market cycles?
Stock market cycles are driven by the interaction of economic growth, interest rates, corporate earnings, and investor psychology. External shocks such as geopolitical events or financial crises can accelerate these cycles.
How long do bull and bear markets usually last?
Historically, bull markets last about 5.5 years on average, while bear markets typically last less than one year.
Do interest rates control the stock market?
Interest rates strongly influence market direction because they affect borrowing costs, liquidity, and asset valuations. However, they are only one factor among many.
Can investors predict market cycles?
Investors cannot predict cycles with precision, but they can identify trends by monitoring economic indicators, earnings growth, and financial conditions.
---
Sources and Further Reading
- Federal Reserve Holds Interest Rates Steady Amid Persistent Inflation — Reuters — 03/18/2026 — https://www.reuters.com
- U.S. Treasury Yields Rise as Markets Reassess Rate Cuts — Bloomberg — 03/21/2026 — https://www.bloomberg.com
- Employment Situation Summary — U.S. Bureau of Labor Statistics — 03/07/2026 — https://www.bls.gov
- S&P 500 Earnings Outlook for 2026 — S&P Global — 01/15/2026 — https://www.spglobal.com
- Global Equity Market Outlook — Bloomberg Intelligence — 01/14/2026 — https://www.bloomberg.com
- Long-Term Stock Market Returns — Morningstar — 12/15/2025 — https://www.morningstar.com
---