Economy
A Recession Signal Is Flashing Again — What Markets Are Watching Now
Seven of twelve leading indicators are in warning territory at the same time.
Markets are watching recession indicators closely again — and the data is making it harder to look away.
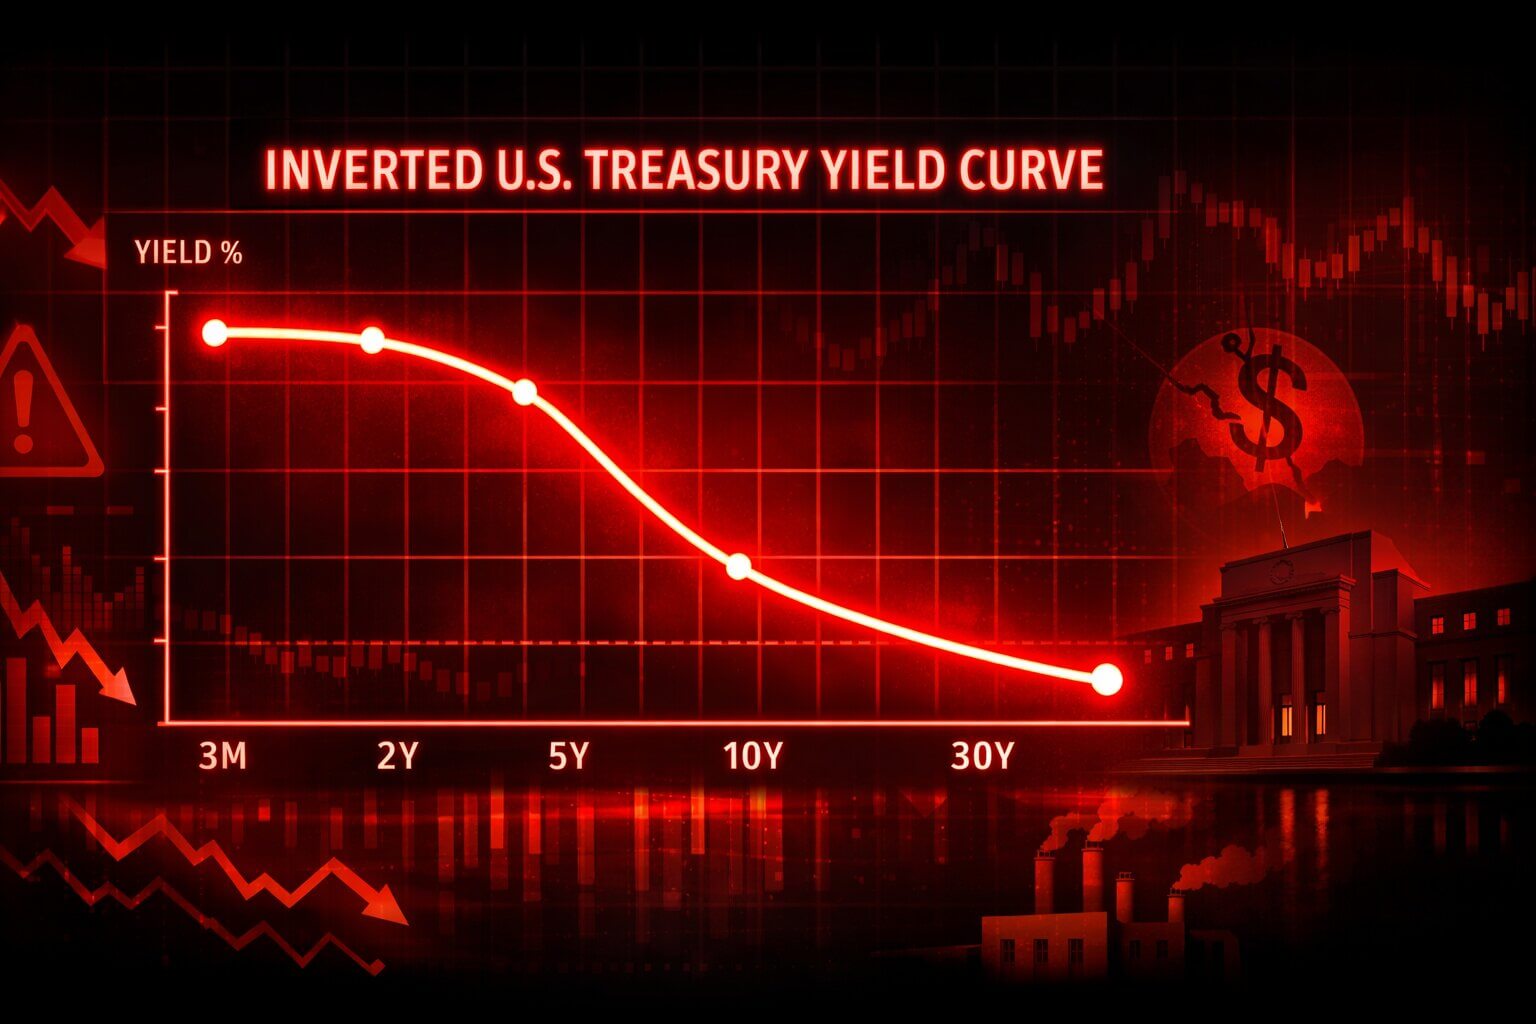
The U.S. Treasury yield curve first inverted in July 2022 — historically one of the most reliable signals of a coming downturn. It remained inverted for an unprecedented 26 months through June 2024. Now it has re-steepened. And that shift, counterintuitively, may be the most dangerous signal yet.
As of 04/24/2026, the 10-year Treasury yields 4.31% against a 2-year yield of 3.78% — a positive spread of 53 basis points. That looks stable on the surface. But history shows that the re-steepening phase, driven by Fed rate cuts into a weakening economy, has preceded the actual onset of recession in 2001 and 2008 by just a few months.
---
Why This Signal Matters Again Now
Recent economic data has reinforced concerns that growth is slowing faster than expected.
The New York Fed's yield curve model currently places the probability of recession within twelve months at 18.8% — still elevated relative to pre-2022 levels. Moody's AI recession model sits at 49%, one bad data print away from crossing 50% — a threshold it has never breached without a recession following within 6 to 12 months. The last time it reached this level outside an actual downturn was September 2007.
Seven of the twelve most closely watched leading and coincident economic indicators are now in warning territory simultaneously. The March 2026 Leading Economic Index showed particular weakness in building permits, new orders for capital goods, and the yield spread between the 10-year Treasury and the federal funds rate — a pattern that matches the pre-recession trajectories of 2000–2001, 2007–2008, and 2019–2020.
Initial unemployment claims have risen to approximately 245,000–255,000 per week, up from a cycle low of 195,000 in late 2023. The VIX has held above 30. Gold has reached $4,524 — capital rotating into safe-haven assets at an accelerating pace.
---
The Real Risk Isn't the Signal — It's the Timing
What makes 2026 unusual is not the warning itself, but how long the economy has resisted it.
Consumer spending has remained resilient, supported by wage growth and household balance sheets that held up through 2025. Corporate earnings in key sectors stayed stable. That resilience has fueled debate about whether traditional indicators are losing predictive power.
More likely, the cycle is simply stretching — and the compression is building.
Goldman Sachs has raised its recession probability estimate to 30%, citing the dual pressure of an oil supply shock and ongoing tariff escalation. From an investor's perspective, the key insight remains behavioral: markets often reprice risk before economic data visibly weakens. When volatility rises and credit conditions tighten, the adjustment can be fast.
The next FOMC meeting on April 28–29 is the most consequential policy decision since the emergency rate cuts of March 2020. A dovish signal could extend the expansion. A hawkish hold — or any sign the Fed is losing control of the inflation narrative — could accelerate the deterioration already visible in leading indicators.
If recession signals continue to strengthen into Q2, market volatility could rise quickly — with few places to hide beyond assets already moving in that direction.
---
FAQ
What is the yield curve inversion?
It occurs when short-term interest rates exceed long-term rates. Historically, this pattern has preceded every U.S. recession since the 1970s, making it one of the most closely watched financial indicators.
Why is the yield curve re-steepening a warning signal?
When the curve un-inverts because the Fed is cutting rates into a weakening economy, it often marks the period just before or concurrent with recession onset — as seen before the 2001 and 2008 downturns.
Are other indicators signaling risk in 2026?
Yes. Seven of twelve leading indicators are in warning territory simultaneously, including the LEI, initial jobless claims, credit spreads, and the VIX above 30.
What should investors watch next?
The April 28–29 Fed meeting is the immediate trigger. Beyond that: labor market trends, Moody's recession model crossing 50%, and whether Goldman's 30% estimate continues to rise.
---
Sources and Further Reading
- U.S. Recession Indicators April 2026 — USRecessionNews — 04/2026 — https://usrecessionnews.com/us-recession-indicators-april-2026/
- Treasury Yields Snapshot April 24, 2026 — Advisor Perspectives — 04/24/2026 — https://www.advisorperspectives.com/dshort/updates/2026/04/24/treasury-yields-snapshot-april-24-2026
---