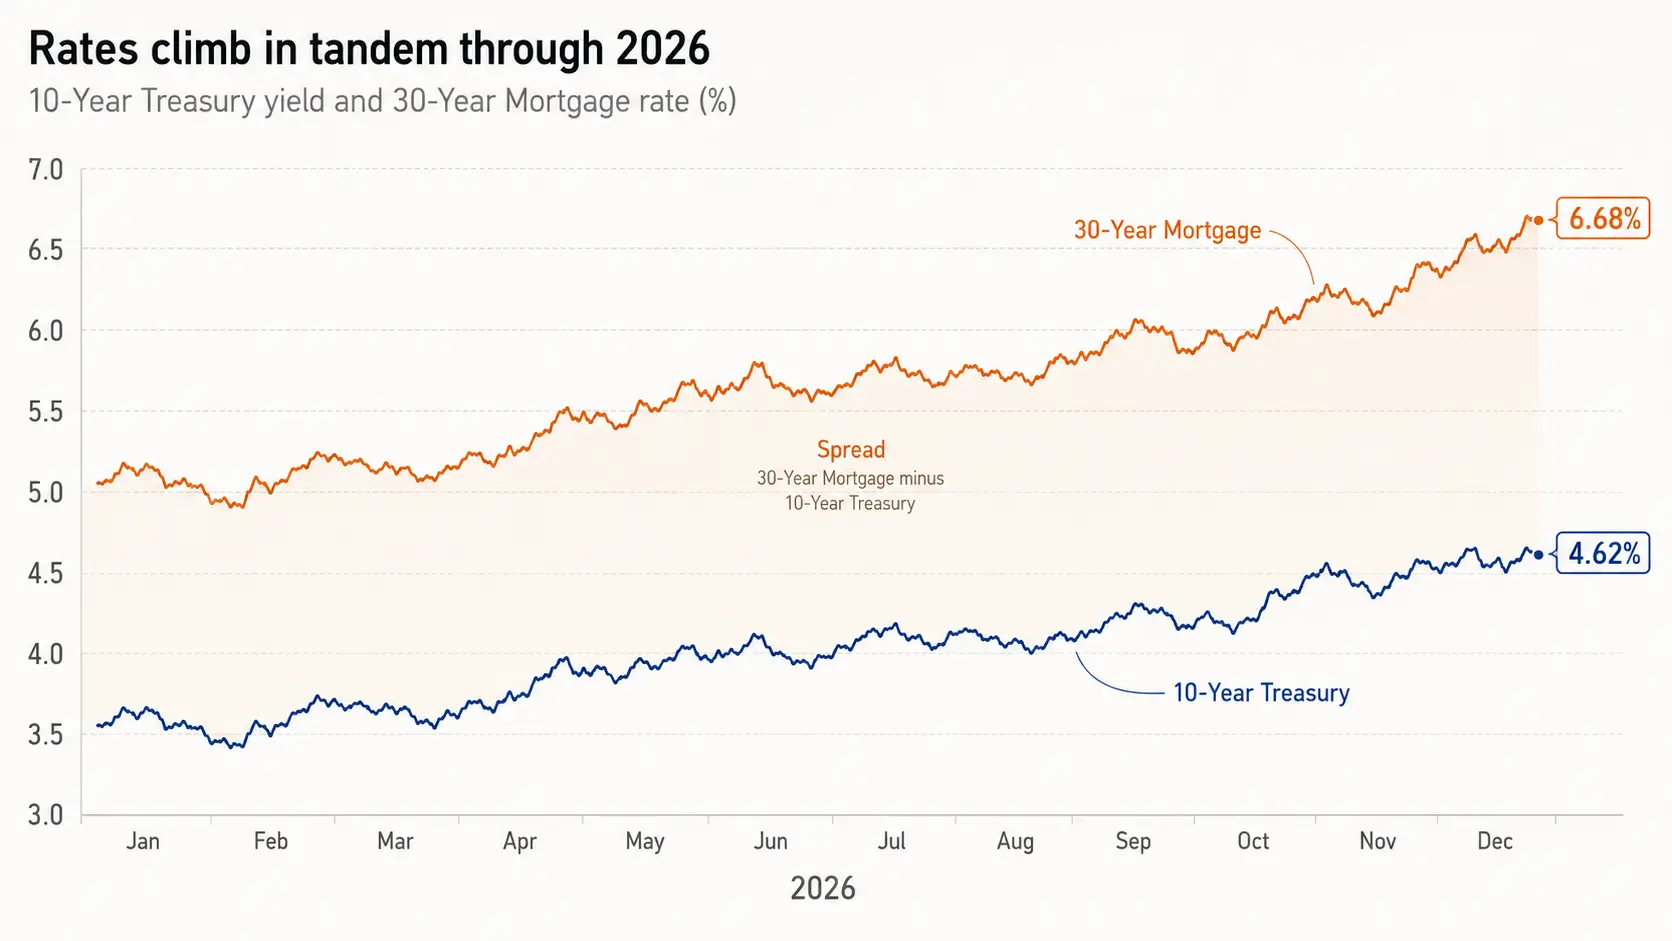
The 10-year Treasury yield closed at 4.62% on May 18, 2026, its highest level in roughly a year. Within hours, the average top-tier 30-year fixed mortgage rate climbed to 6.68% — a nine-month high — according to Mortgage News Daily's daily index. If you are buying or refinancing this spring, the 10 year treasury yield mortgage rates relationship is the single most important variable in your monthly payment. It is also widely misunderstood.
This guide explains how that yield translates into your mortgage rate, why the move is not one-for-one, what the current level implies for affordability through June 2026, and how to think about locking, waiting, or walking.
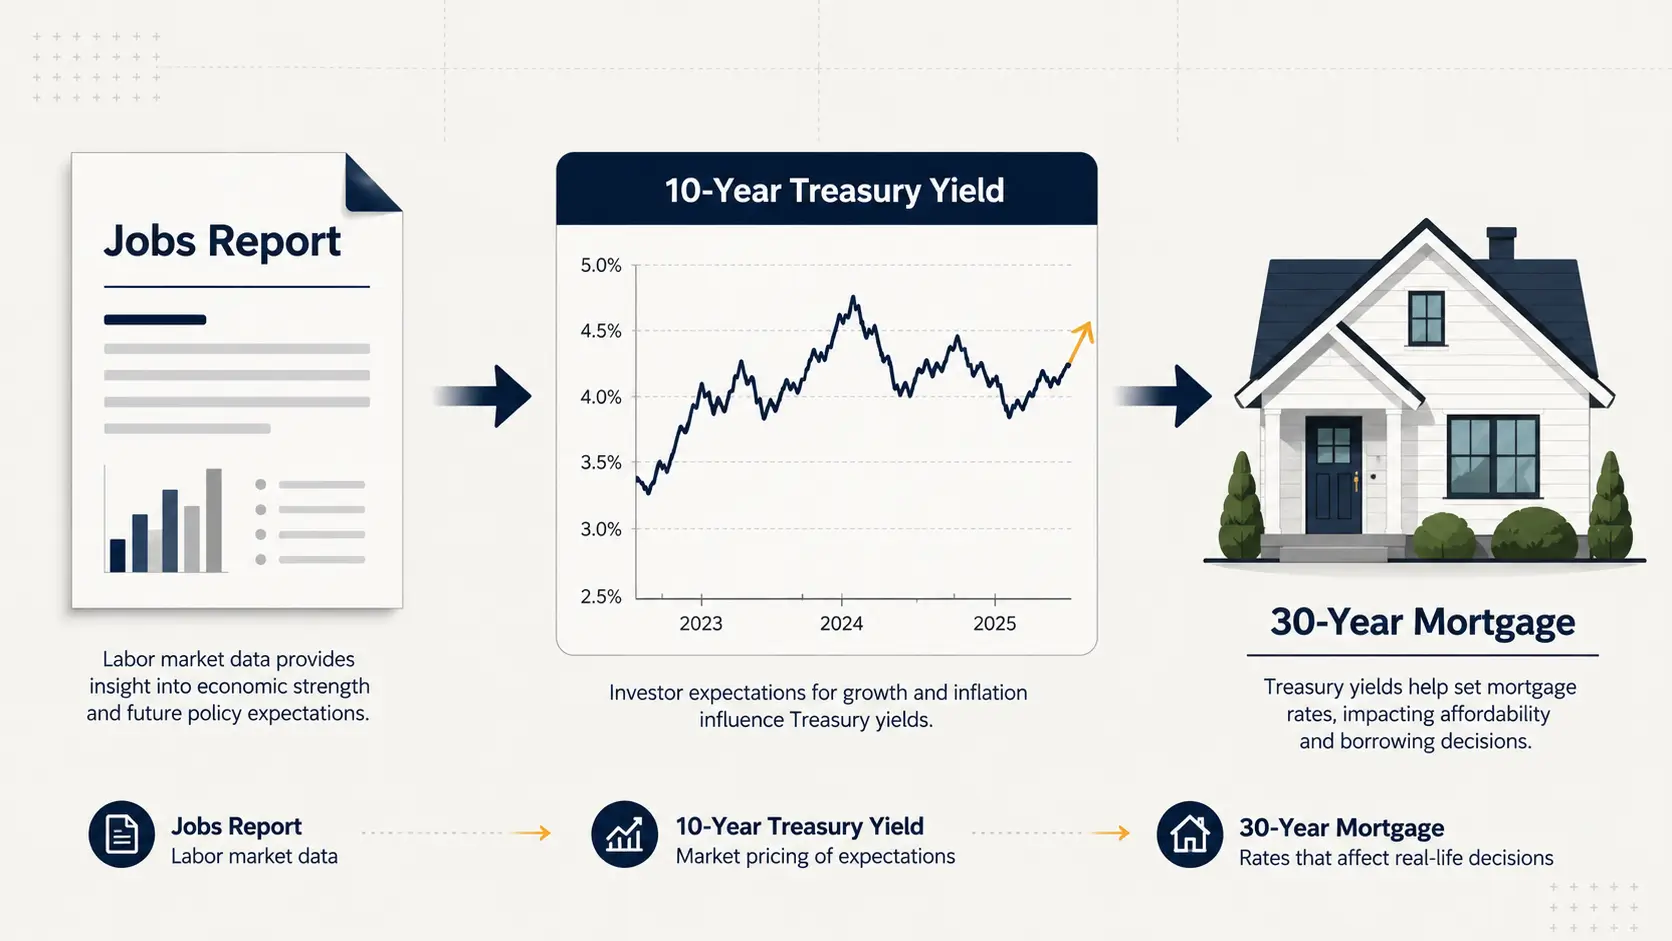
How the 10-Year Treasury Sets Your Mortgage Rate
Mortgage lenders do not price 30-year loans off the federal funds rate. They price them off the 10-year Treasury — and behind it, the secondary market for mortgage-backed securities (MBS).
The reason is duration. The 30-year mortgage has a contractual life of three decades, but its effective life — the average time before borrowers refinance, sell, or pay off — runs closer to seven to 10 years. That matches the 10-year Treasury, which is why the two move together across cycles.
When investors buy MBS, they demand a yield above the 10-year Treasury to compensate for prepayment risk, credit risk, and the option borrowers hold to refinance when rates fall. Lenders then add their margin on top of MBS yields. The result: your 30-year rate roughly equals the 10-year yield, plus a spread.
The Federal Reserve influences this chain indirectly — through the path of short rates, balance sheet runoff, and inflation expectations — but it does not set the mortgage rate directly. The bond market does.
Why the Spread Isn't 1:1
Between 1990 and 2021, the spread between the 30-year fixed mortgage and the 10-year Treasury averaged about 170 basis points, according to Mortgage Bankers Association data. With the 10-year at 4.62% and the daily mortgage average at 6.68% on May 18, 2026, the current spread sits near 206 basis points — meaningfully wider than the long-run norm.
Several forces keep it stretched. Rate volatility, measured by the MOVE Index, remains elevated relative to the 2010s, and lenders price in that uncertainty. The Federal Reserve is no longer a buyer of MBS — its balance sheet runoff has removed the largest non-economic bid that compressed spreads in 2020–2021. Slower prepayment speeds in a higher-rate environment also extend MBS duration, which raises the yield investors require.
The practical implication: even if the 10-year yield falls 50 basis points, your mortgage rate may not. Spreads can absorb part of the move — or, in stress periods, widen and offset it entirely. This same dynamic shapes how higher rate levels reset what banks pay on deposits and charge on loans across the broader credit system.
What 4.62% Means for the Spring Buying Season
On a $400,000 loan, the move from a 6.36% rate (Freddie Mac PMMS average for the week of May 14, 2026) to 6.68% adds roughly $85 to the monthly principal-and-interest payment and about $30,500 in interest over the 30-year term. With the median existing-home sale price at $408,800 in March 2026 per the National Association of Realtors, the affordability hit on the marginal buyer is material.
Housing starts hit a 17-month high of 1.502 million annualized units in March 2026 per the Census Bureau, but the April release on May 21 will show whether builders kept pace as yields climbed. Existing-home sales for March ran at a 3.98-million annualized pace, suggesting buyers are absorbing higher rates only at the margin. The same rate environment is visible in how households are adjusting their broader budgets — discretionary categories tend to compress before housing decisions reverse.
Decision Rules for Buyers and Refinancers in May–June 2026
For buyers with a signed purchase agreement, the question is whether to lock now or float. With the 10-year near a 12-month high, the near-term asymmetry favors locking unless your closing date sits more than 60 days out. A 30- to 45-day lock at 6.68% is defensible; floating works only if you have a clear thesis on disinflation that the market is mispricing.
For refinancers, the math is simpler. Most existing borrowers carry rates between 3% and 5% from 2020–2022 originations, so traditional rate-and-term refinancing is unattractive at current levels. The exceptions: cash-out refinances where home equity solves a higher-cost debt problem (credit cards averaging above 20%), or borrowers who took 7%-plus mortgages in late 2023 who could shave 30 to 50 basis points.
For buyers without urgency, the case to wait depends on whether oil prices ease, Middle East tensions de-escalate, and the May CPI print due June 11 cools. Each is uncertain. Renting through the summer and revisiting in autumn is rational if your timeline allows it.
What to Watch Next
Three data points will set direction into June. The April Housing Starts release on May 21 will signal builder confidence. The May CPI report on June 11 will test whether the recent inflation re-acceleration extends. The June 17–18 FOMC meeting under newly installed Chair Kevin Warsh — sworn in May 22 — will reveal whether the Fed's reaction function has shifted under new leadership. A hot CPI or a hawkish Fed could push the 10-year toward 4.80% and mortgage rates toward 7%. Cooling data could pull both lower — but the spread is the wildcard.
Frequently Asked Questions
Why do mortgage rates follow the 10-year Treasury and not the 30-year Treasury? Because the effective life of a 30-year mortgage — accounting for refinancing and home sales — averages closer to a decade. That matches the 10-year Treasury's duration, making it the natural benchmark for pricing mortgage-backed securities and, in turn, mortgage rates.
Does the Federal Reserve directly set mortgage rates? No. The Fed sets the overnight federal funds rate, which influences short-term borrowing costs and inflation expectations. Long-term mortgage rates respond to the bond market's view of inflation and growth over the next decade, anchored by the 10-year Treasury.
What is a "normal" spread between the 10-year Treasury and the 30-year mortgage? Between 1990 and 2021, the spread averaged roughly 170 basis points, according to the Mortgage Bankers Association. Since 2022, it has consistently exceeded 200 basis points due to elevated rate volatility, Fed balance sheet runoff, and slower prepayment speeds on MBS.
Should I lock my mortgage rate at 6.68%? That depends on your closing timeline and risk tolerance. With the 10-year Treasury near a 12-month high and inflation data still hot, the near-term asymmetry favors locking on contracts closing within 30 to 45 days. Floating makes sense only if you have a high-conviction thesis that the market is mispricing the path of inflation.
Sources and Further Reading
- Mortgage Rates Start Week at New 9 Month High, But Just Barely — Mortgage News Daily — 05/18/2026 — https://www.mortgagenewsdaily.com/mortgage-rates
- Primary Mortgage Market Survey, Week Ending May 14, 2026 — Freddie Mac — 05/14/2026 — https://www.freddiemac.com/pmms
- MBA Chart of the Week: 30-Year Fixed Mortgage Rate and 10-Year Treasury Yield — Mortgage Bankers Association — 06/04/2024 — https://newslink.mba.org/servicing-newslink/2024/june/mba-servicing-newslink-tuesday-june-4-2024/mba-chart-of-the-week-30-year-fixed-mortgage-rate-and-10-year-treasury-yield/
- New Residential Construction, March 2026 — U.S. Census Bureau and HUD — 04/29/2026 — https://www.census.gov/construction/nrc/pdf/newresconst.pdf