The story of corporate debt in 2026 is not the crisis many analysts forecast a year ago. It is something more nuanced — and arguably more interesting.
As of May 2026, global non-financial corporate debt has reached $100.6 trillion, according to the Institute of International Finance's February 2026 Global Debt Monitor. That is a record. Yet U.S. speculative-grade default rates are projected to fall to roughly 3.0% by October 2026, down from 5.3% a year earlier, according to Moody's Ratings. The Federal Reserve has cut its target range to 3.50%–3.75% — down from the 5.25%–5.50% peak reached in July 2023 and held through August 2024. Investment-grade corporate spreads sit near 78 basis points, in the second percentile over a 20-year lookback.
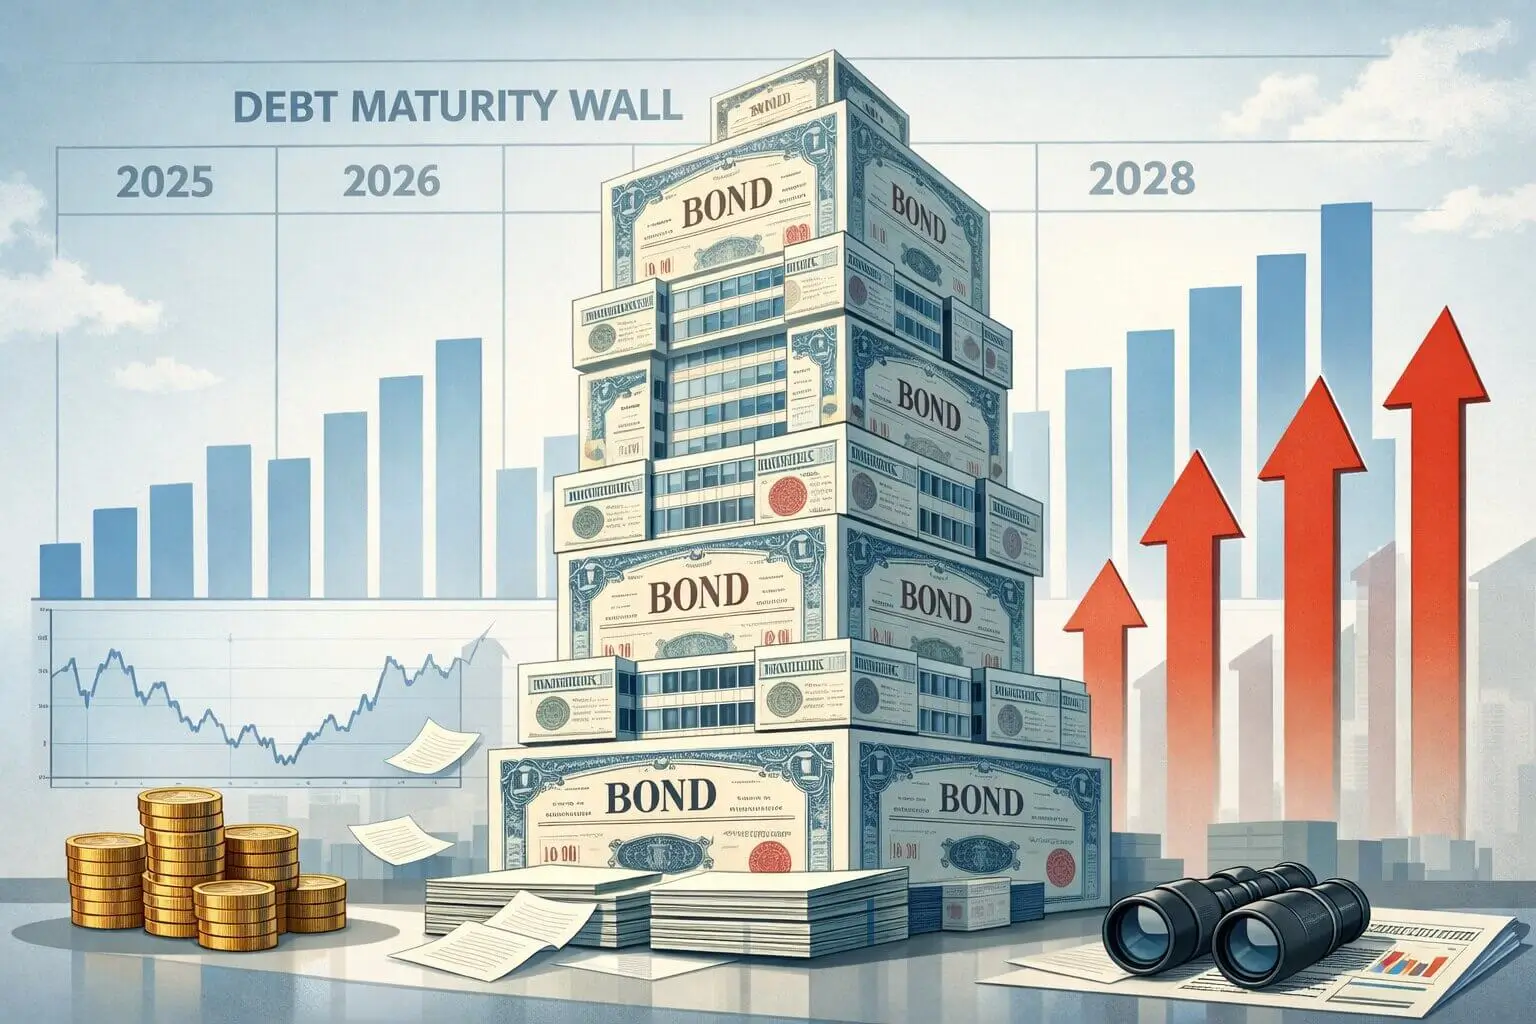
The "higher for longer" rate anxiety that defined 2024 has softened. The infamous maturity wall — trillions in corporate debt coming due between 2025 and 2029 — is being absorbed without visible distress.
But the calmer surface masks a changed risk landscape. Hyperscaler borrowing tied to AI infrastructure is now the dominant new credit story, and JPMorgan CEO Jamie Dimon warned in February 2026 that "there will be some kind of bond crisis." For investors, the question in 2026 is no longer whether corporate debt is dangerously high. It is whether today's easier conditions are pricing the right risks — or masking the wrong ones.
A Decade of Cheap Credit Meets a Lower-Rate Reset
The Legacy of the 2020–2021 Borrowing Boom
During the pandemic, corporations exploited historically low rates to issue record debt. Global firms borrowed trillions in 2020 and 2021 to shore up liquidity, refinance existing obligations, and fund expansion. Central banks had cut policy rates to near zero, and bond investors absorbed every issuance.
When the Federal Reserve launched its most aggressive tightening cycle in decades in March 2022, that protection started to wear. By July 2023, the federal funds rate hit a range of 5.25%–5.50%, where it stayed through the summer of 2024.
Why Rates Came Down — But Not All the Way
Beginning in September 2024, the Fed pivoted to cuts. As of the April 28–29, 2026 FOMC meeting, the target range stands at 3.50%–3.75%, and the March 2026 Summary of Economic Projections shows policymakers expecting one more cut in 2026 and another in 2027.
Even so, refinancing costs remain materially above the pandemic-era baseline. A firm that locked in 2.5% in 2020 still faces 5%–7% all-in costs to refinance today, depending on credit quality. The difference is not incremental for highly levered borrowers; it is structural.
The 2025–2029 Maturity Wall Meets Easier Refinancing
The Scale of Upcoming Refinancing Needs
S&P Global Ratings estimates roughly $12.4 trillion in S&P-rated corporate debt — $9.0 trillion investment grade, $3.4 trillion speculative — will mature between 2025 and 2029. The IIF puts advanced-economy corporate maturities at more than $20 trillion in 2026 alone, with emerging markets facing another $9 trillion.
So far, the wall is being scaled without drama. Strong demand from insurers, pension funds, and foreign buyers has absorbed heavy supply, and Moody's projects U.S. speculative-grade defaults to drop to 3.0% by October 2026, with Europe falling to 2.4%.
Why Tight Spreads Are Smoothing the Wall
Investment-grade option-adjusted spreads ended Q4 2025 at 78 basis points, near a 20-year low. The Bloomberg U.S. Corporate High-Yield Index option-adjusted spread sits around 2.78%, well below its 20-year average of 4.9%.
In plain terms: lenders are not demanding meaningful risk premiums. That makes refinancing easier today — and leaves less margin for tomorrow.
Why This Risk Is Different From Past Credit Cycles
A System-Wide Structural Vulnerability
Unlike 2008 (housing) or 2023 (regional banks), the current risk is spread across corporate balance sheets globally. The OECD warns that 38% of outstanding corporate bonds will mature within three years, requiring sustained investor appetite to refinance without disruption.
For more than a decade, low rates allowed companies to refinance repeatedly without reducing leverage. That model — refinancing dependence — is now being tested at higher equilibrium rates.
The AI Capex Concentration
The newest layer is concentrated. The five largest U.S. hyperscalers — Microsoft, Amazon, Alphabet, Meta, and Oracle — are projected to spend roughly $725 billion in 2026 capital expenditure, up about 77% from $410 billion in 2025. Big tech issued more than $100 billion in bonds in early 2026 to fund AI infrastructure, and Morgan Stanley projects full-year hyperscaler issuance above $400 billion — more than double the $165 billion raised in 2025.
Alphabet has placed a 100-year European bond. Oracle issued $25 billion in debt alongside $25 billion in equity to fund its build-out. These are investment-grade names with strong balance sheets — but the credit risk is being concentrated in a single thesis: that AI revenue will materialize fast enough to service the debt.
Why This Matters Again Now
Three developments since early 2026 have sharpened the picture. Moody's downgraded U.S. sovereign debt to Aa1 from Aaa on May 16, 2025, citing rising federal debt and interest costs — a benchmark shift that pressures the entire corporate yield curve. The April 2026 Senior Loan Officer Opinion Survey showed banks tightening lending standards on commercial and industrial loans across firm sizes, even as loan demand stayed flat. And the Federal Reserve's May 8, 2026 Financial Stability Report flagged elevated risk from high debt levels and stretched valuations.
None of these are crisis triggers. Together, they signal that the system is more sensitive to a shock than current spreads imply.
What Investors Should Watch in 2026 and Beyond
Investors and policymakers track several metrics that typically signal rising stress in corporate credit: interest coverage ratios in leveraged sectors, trailing default rates for speculative-grade issuers, high-yield spreads, the quarterly SLOOS print on C&I lending standards, and AI-related hyperscaler issuance volume.
Base case: the maturity wall is refinanced in tranches, defaults stay near 3%, and AI capex continues to be absorbed. Most analysts treat this as the central path through 2027.
Stress case: AI revenue disappoints, spreads widen sharply on concentrated tech issuance, and refinancing for lower-rated borrowers tightens.
Severe case: a recession or shock combines with AI repricing, exposing leveraged corners — private credit, commercial real estate, lower-tier high-yield — to concentrated defaults.
Corporate debt is unlikely to trigger an abrupt shock this year. Default rates are falling, refinancing windows remain open, and the Fed is in a gradual easing posture. But the era of effortless refinancing is over, and the next chapter is being written by AI capex and concentrated investment-grade issuance — not by the leveraged loans that defined the last cycle. For investors, the strategic takeaway is to watch where credit risk is being repriced, not where it is being repaid.
FAQ
Why is corporate debt drawing attention in 2026? Global non-financial corporate debt has reached a record $100.6 trillion, and more than $20 trillion in advanced-economy corporate debt matures in 2026 alone. Even with rates lower than the 2023 peak, refinancing remains materially more expensive than pandemic-era borrowing — and tight spreads leave little cushion if conditions tighten.
What is the corporate maturity wall? The maturity wall refers to a period when large amounts of debt come due simultaneously. S&P estimates roughly $12.4 trillion in rated corporate debt will mature between 2025 and 2029, requiring sustained refinancing capacity throughout the window.
Could corporate debt trigger a financial crisis in 2026? Most analysts see the base case as gradual rather than disruptive. Moody's projects U.S. speculative-grade defaults will fall to about 3.0% by October 2026. Risk is concentrated in pockets — AI-linked issuance, commercial real estate, private credit, lower-tier high-yield — rather than the system as a whole.
What indicators should investors monitor? Key signals include corporate default rates, interest coverage ratios, investment-grade and high-yield credit spreads, the Fed's quarterly Senior Loan Officer Opinion Survey, and the pace and pricing of hyperscaler bond issuance. These typically deteriorate before broader economic weakness becomes visible.
Sources and Further Reading
- Global Debt Monitor (February 2026 Edition) — Institute of International Finance — 02/25/2026 — https://www.iif.com/LinkClick.aspx?fileticket=tEhC0oymVlM%3D
- Global Debt Hits Record $348 Trillion as Governments Boost Borrowing in 2025 — Bloomberg — 02/25/2026 — https://www.bloomberg.com/news/articles/2026-02-25/global-debt-surges-to-348-trillion-as-deficit-spending-rises
- Financial Stability Report, May 2026 — Federal Reserve Board — 05/08/2026 — https://www.federalreserve.gov/publications/files/financial-stability-report-20260508.pdf
- The April 2026 Senior Loan Officer Opinion Survey on Bank Lending Practices — Federal Reserve Board — 05/05/2026 — https://www.federalreserve.gov/data/sloos/sloos-202604.htm
- Global Leveraged Finance and CLOs Outlooks 2026 — Moody's Ratings — 12/09/2025 — https://www.moodys.com/web/en/us/insights/credit-risk/outlooks/global-leveraged-finance-and-clos.html