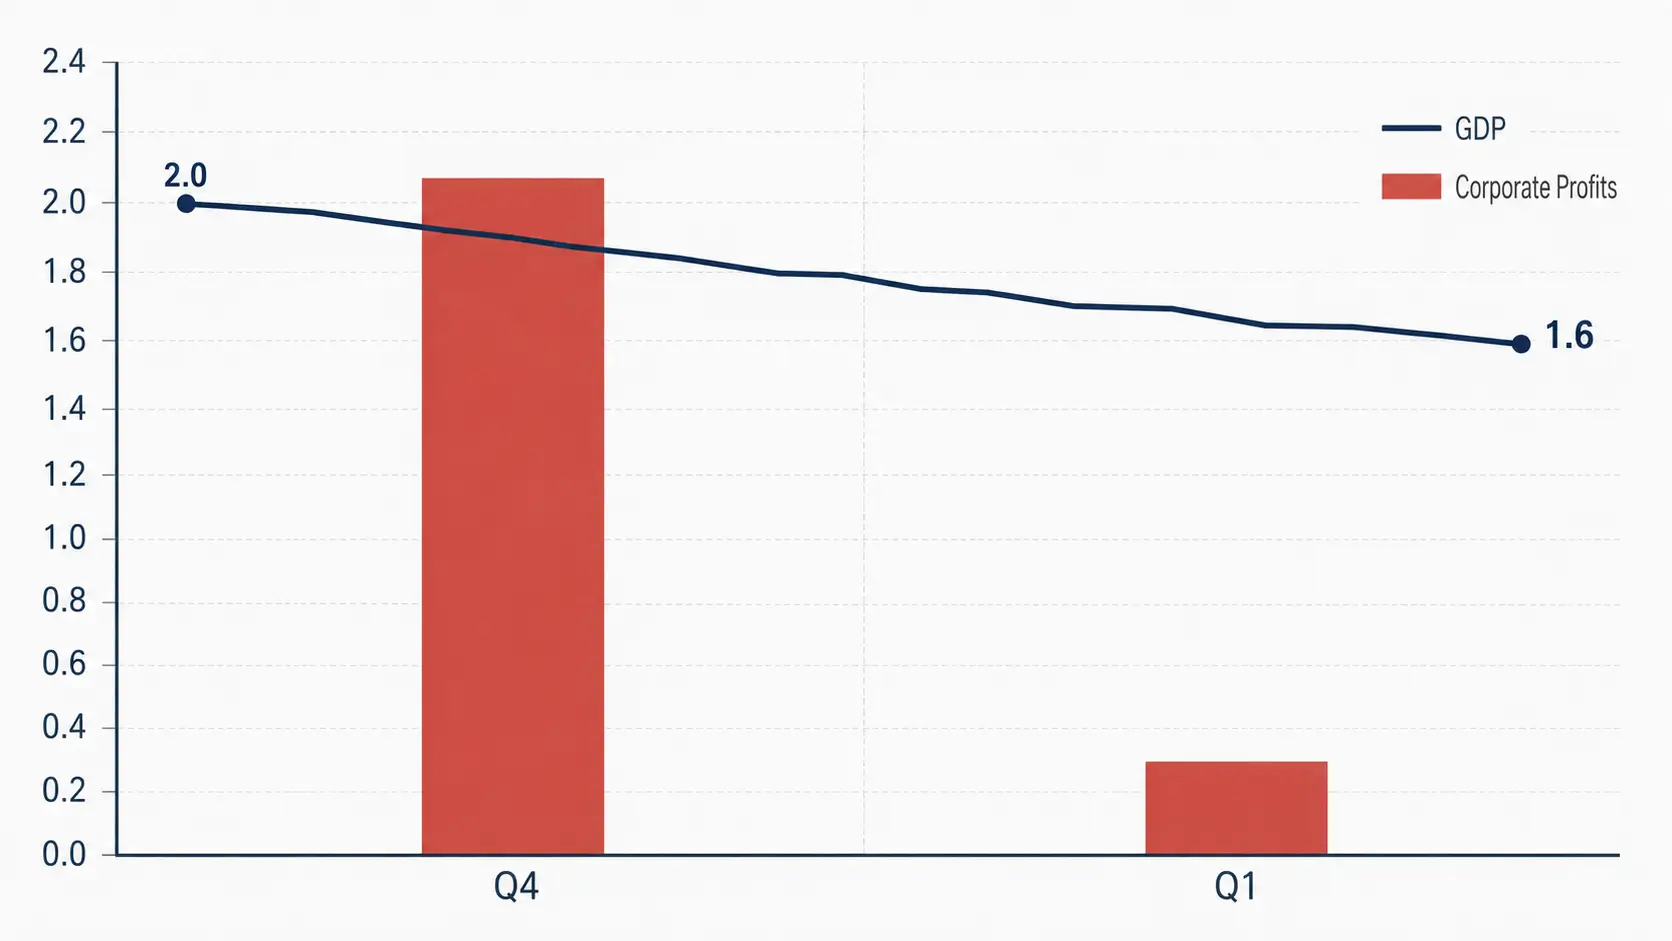
The economy grew slower than first reported, and corporate profits nearly stopped rising. The GDP Q1 2026 second estimate and corporate profits release, published by the Bureau of Economic Analysis on May 28, 2026, revised first-quarter growth down to a 1.6% annual rate from the 2.0% advance reading — a 0.4 percentage point cut driven by weaker investment and consumer spending.
That revision is larger than the typical second-estimate adjustment. But the number equity allocators should be circling is buried lower in the release: profits from current production rose just $40.4 billion in Q1, against a $246.9 billion gain in the fourth quarter of 2025. The engine of the headline economy held up. The profit engine did not.
What the revision actually changed
The downgrade was not cosmetic. The BEA attributed the 0.4 point cut primarily to downward revisions in private inventory investment — led by manufacturing and retail trade — and in consumer spending on services, where health care outlays were marked down on fresh Census Bureau survey data.
Strip the noise and one number stands out. Real final sales to private domestic purchasers — consumer spending plus business fixed investment, the cleanest read on underlying private demand — grew 2.4% in Q1, revised down only 0.1 point. That figure removes the swings from inventories, trade, and government. It says private demand was steadier than the headline cut implies, even as the top-line growth rate slipped. For allocators worried about a consumer cliff, that is the more reassuring line. The recession-signal debate we covered in our look at U.S. recession risk this spring hinges on exactly this distinction between headline volatility and core demand.
The profit number that informs FY26 models
Here is the tension. The macro profits data turned sharply lower, yet the bottom-up earnings picture looks the opposite. FactSet's blended net profit margin for the S&P 500 in Q1 2026 came in at 13.4%, the highest since its tracking began in 2009, with analysts projecting full-year 2026 earnings growth above 18%.
Both can be true. BEA's profits-from-current-production measure spans the entire corporate sector — private firms, financials, and small companies excluded from any index — and adjusts for inventory and depreciation. The S&P 500 is a concentrated, large-cap, margin-rich slice dominated by technology. When the broad measure decelerates while the index sets margin records, it signals that profit strength is narrowing toward the biggest names rather than broadening across the economy.
For anyone building FY26 EPS estimates, that narrowing is the warning. Bottom-up models that extrapolate index margins across the corporate landscape risk overstating breadth. The first published profits cut of this cycle says the gains are getting more concentrated, not more durable.
Why the GDI gap matters
A third number reinforces the caution. Real gross domestic income rose just 0.9% in Q1, well below the 1.6% GDP figure. GDI measures the economy from the income side — wages, profits, and interest — and over time it should track GDP closely. When income growth lags output growth this much, it often means the production side is flattering the picture.
The average of GDP and GDI, which some economists treat as a cleaner gauge, rose 1.3%. That sits below both the headline and the advance estimate, and it leans toward the softer interpretation of the quarter. Rising leverage adds to the unease here — a dynamic we examined in our analysis of corporate debt as a market risk, where thinner profit cushions raise the stakes on refinancing.
What happens next
The risk is asymmetric into the back half of 2026. With the shutdown-rebound in federal compensation and Iran-related defense outlays already in the Q1 base, those tailwinds fade from here, leaving private demand to carry the load. If profits stay soft while the S&P 500 trades at a forward price-to-earnings ratio above 20 — well over its 10-year average near 19 — the cushion for any earnings disappointment is thin.
The next checkpoint is the third GDP estimate and revised corporate profits on June 25, 2026, alongside incoming PCE inflation data that will shape the Fed's rate path. Allocators should treat the 1.6% print as a prompt to stress-test FY26 earnings assumptions against a narrower, slower-growing profit base — not to extrapolate record index margins across the whole economy.
Frequently Asked Questions
Why was GDP Q1 2026 revised down to 1.6%? The BEA cut the figure 0.4 percentage point from the 2.0% advance estimate, primarily because of downward revisions to private inventory investment in manufacturing and retail and to consumer spending on health care services, based on updated Census Bureau data.
What did corporate profits do in Q1 2026? Profits from current production rose $40.4 billion, a sharp slowdown from the $246.9 billion gain in Q4 2025. The deceleration in the broad profit measure contrasts with record S&P 500 net margins of 13.4%.
Why is GDI lower than GDP this quarter? Real GDI rose 0.9% versus 1.6% for GDP. Because GDI measures the economy from the income side, a gap this wide can signal that output-side data is overstating the quarter's underlying strength.
What should investors watch next? The third GDP estimate and revised corporate profits arrive June 25, 2026, along with PCE inflation data. Both will help clarify whether private demand can sustain growth as Q1's temporary tailwinds fade.
Sources and Further Reading
- GDP (Second Estimate) and Corporate Profits, 1st Quarter 2026 — U.S. Bureau of Economic Analysis — 05/28/2026 — https://www.bea.gov/news/2026/gdp-second-estimate-and-corporate-profits-1st-quarter-2026
- S&P 500 Reporting Highest Net Profit Margin in More Than 15 Years — FactSet — 05/01/2026 — https://insight.factset.com/sp-500-reporting-highest-net-profit-margin-in-more-than-15-years-1
- Near Record Highs, Stocks Face Fresh Test From Bond Yields — CNN Business — 05/26/2026 — https://www.cnn.com/2026/05/26/business/us-stocks-bond-yields