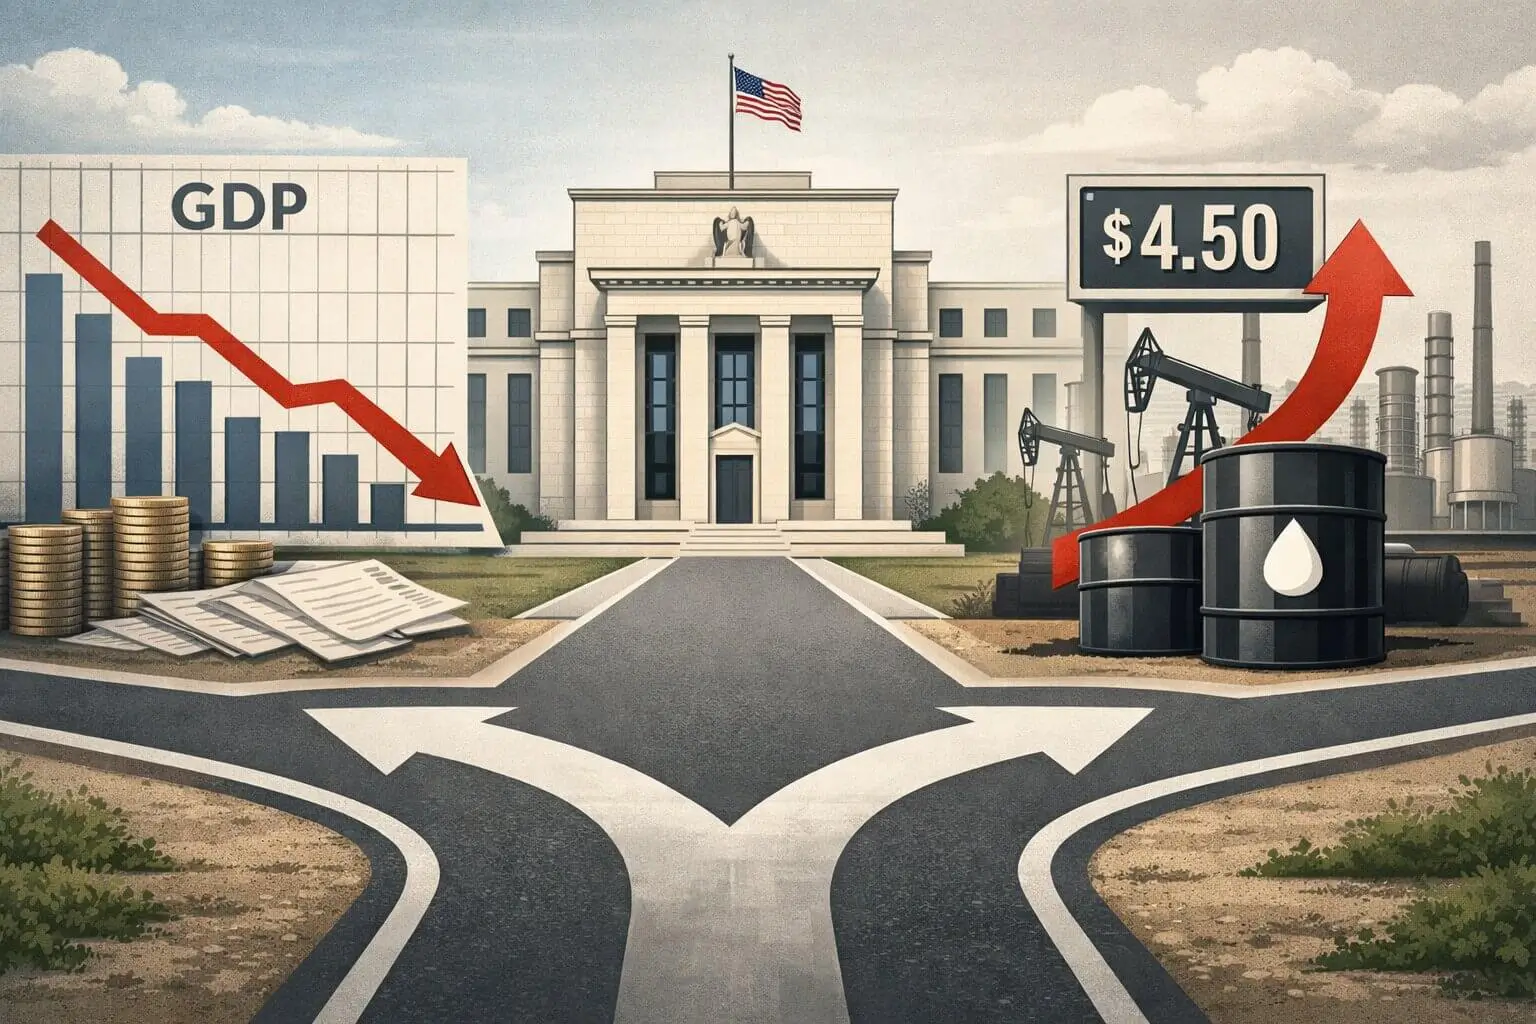
Two months ago, the U.S. economy looked like it was drifting toward recession. By late May 2026, the diagnosis has shifted — and not for the better. Real GDP rebounded to a 2.0% annualized pace in Q1, while April inflation reaccelerated to 3.8% and consumer sentiment collapsed to the lowest level in the 74-year history of the University of Michigan survey. The recession scare has receded. Stagflation risk has replaced it.
Why This Matters Again Now
When we examined the U.S. recession narrative in March 2026, the trigger was a weak Q4 2025 GDP print and a sentiment drop tied to early Iran-related oil pressures. Two months later, three things have changed.
First, growth surprised to the upside in Q1. Second, inflation surprised to the upside in April. Third, the Federal Reserve fractured publicly at its April 29 meeting, with four officials dissenting — the largest number since October 1992. Stagflation moved from a theoretical concern in March to a measurable one by May. That shift is the consequence that now matters for portfolios, hiring decisions, and rate expectations.
Growth Rebounded, But on Fragile Footing
The Bureau of Economic Analysis on 04/30/2026 released its advance estimate of Q1 2026 GDP at 2.0% annualized, missing the 2.3% consensus but accelerating sharply from the 0.5% Q4 2025 final figure. The composition matters more than the headline. Federal nondefense compensation rebounded after a late-2025 shutdown drag, and Iran-related defense outlays added to government spending. Underlying consumer spending decelerated.
Real final sales to private domestic purchasers — the cleaner measure of underlying demand — rose 2.5%, an improvement, but not enough to confirm a durable acceleration. The handoff from public-sector tailwinds to private consumption is the critical question for the Q2 and Q3 prints.
Inflation Reaccelerated, Hard
April's CPI release on 05/12/2026 broke the disinflation narrative that defined late 2025. Headline CPI rose 0.6% month-over-month and 3.8% year-over-year — the hottest annual print since May 2023. Core CPI rose 0.4% on the month and 2.8% over the year, also a multi-month high.
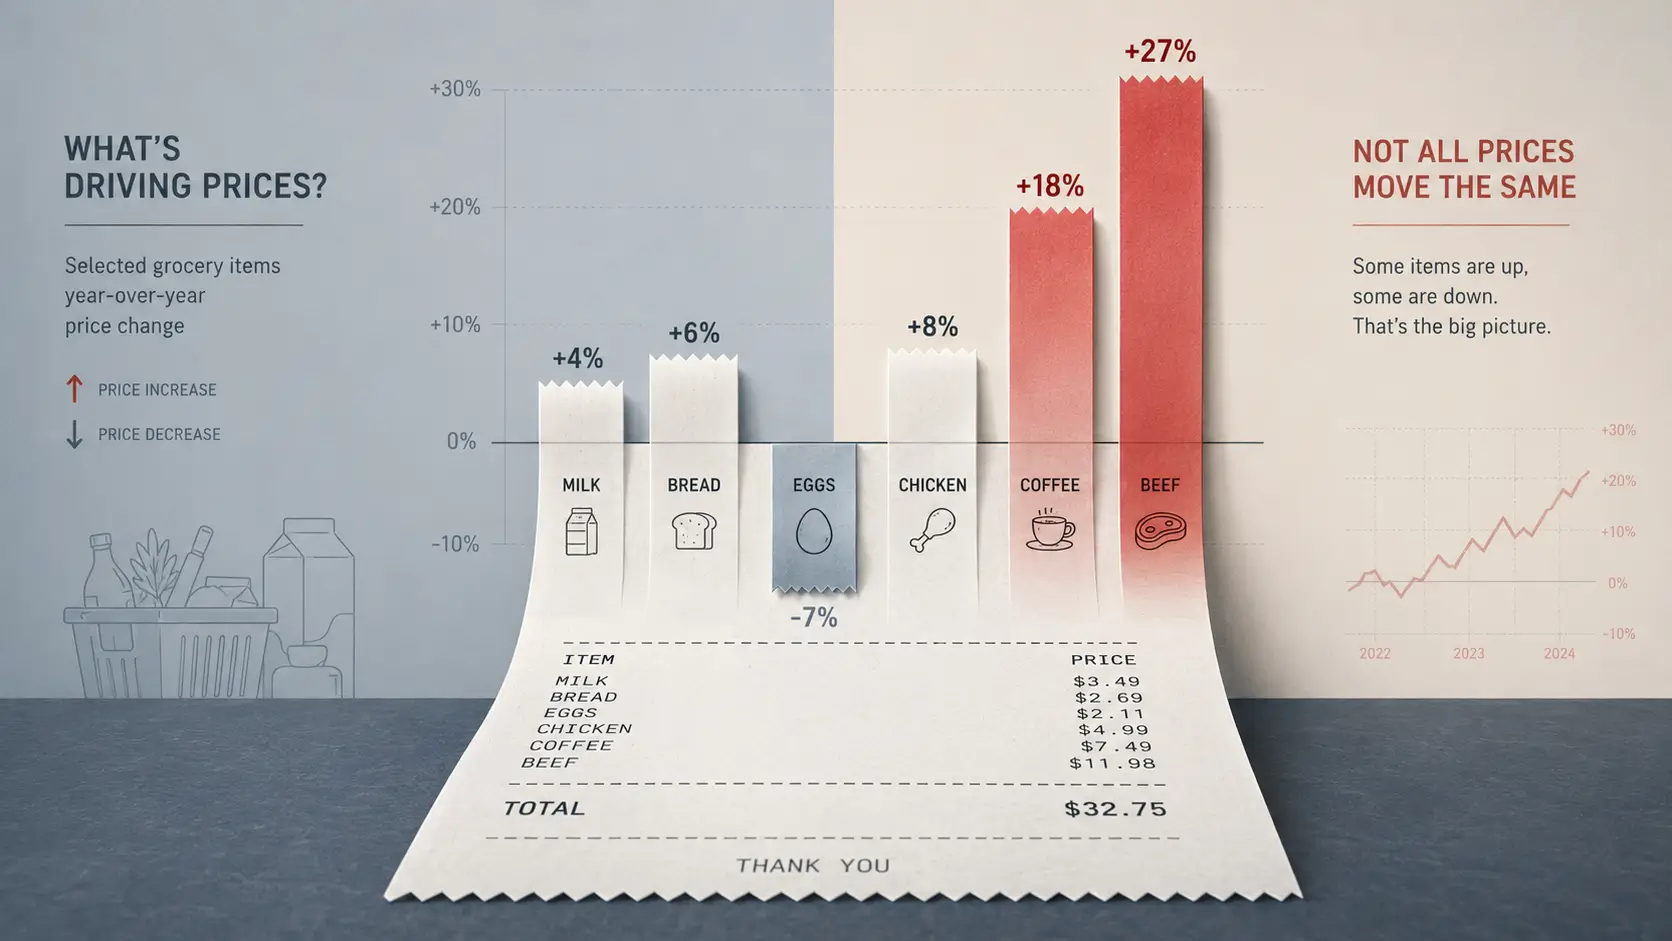
Energy did the heavy lifting. Gasoline climbed 28.4% year-over-year on Strait of Hormuz supply disruptions tied to the ongoing Iran war. Energy prices overall rose 17.9% annually, contributing more than 40% of the headline gain. But inflation is no longer confined to oil: shelter accelerated to 3.3%, and food prices posted their largest monthly increase since August 2022. This is the price profile the Fed feared in late 2025 — sticky and broadening.
Consumers and Labor Are Signaling Stress
The University of Michigan's final May reading, released 05/22/2026, came in at 44.8 — the lowest in the survey's history, blowing past the previous record low of 50 set in June 2022. One-year inflation expectations climbed to 4.8% and five-year expectations to 3.9%, both meaningfully above pre-Iran-war readings. About 57% of respondents spontaneously cited high prices as eroding their finances.
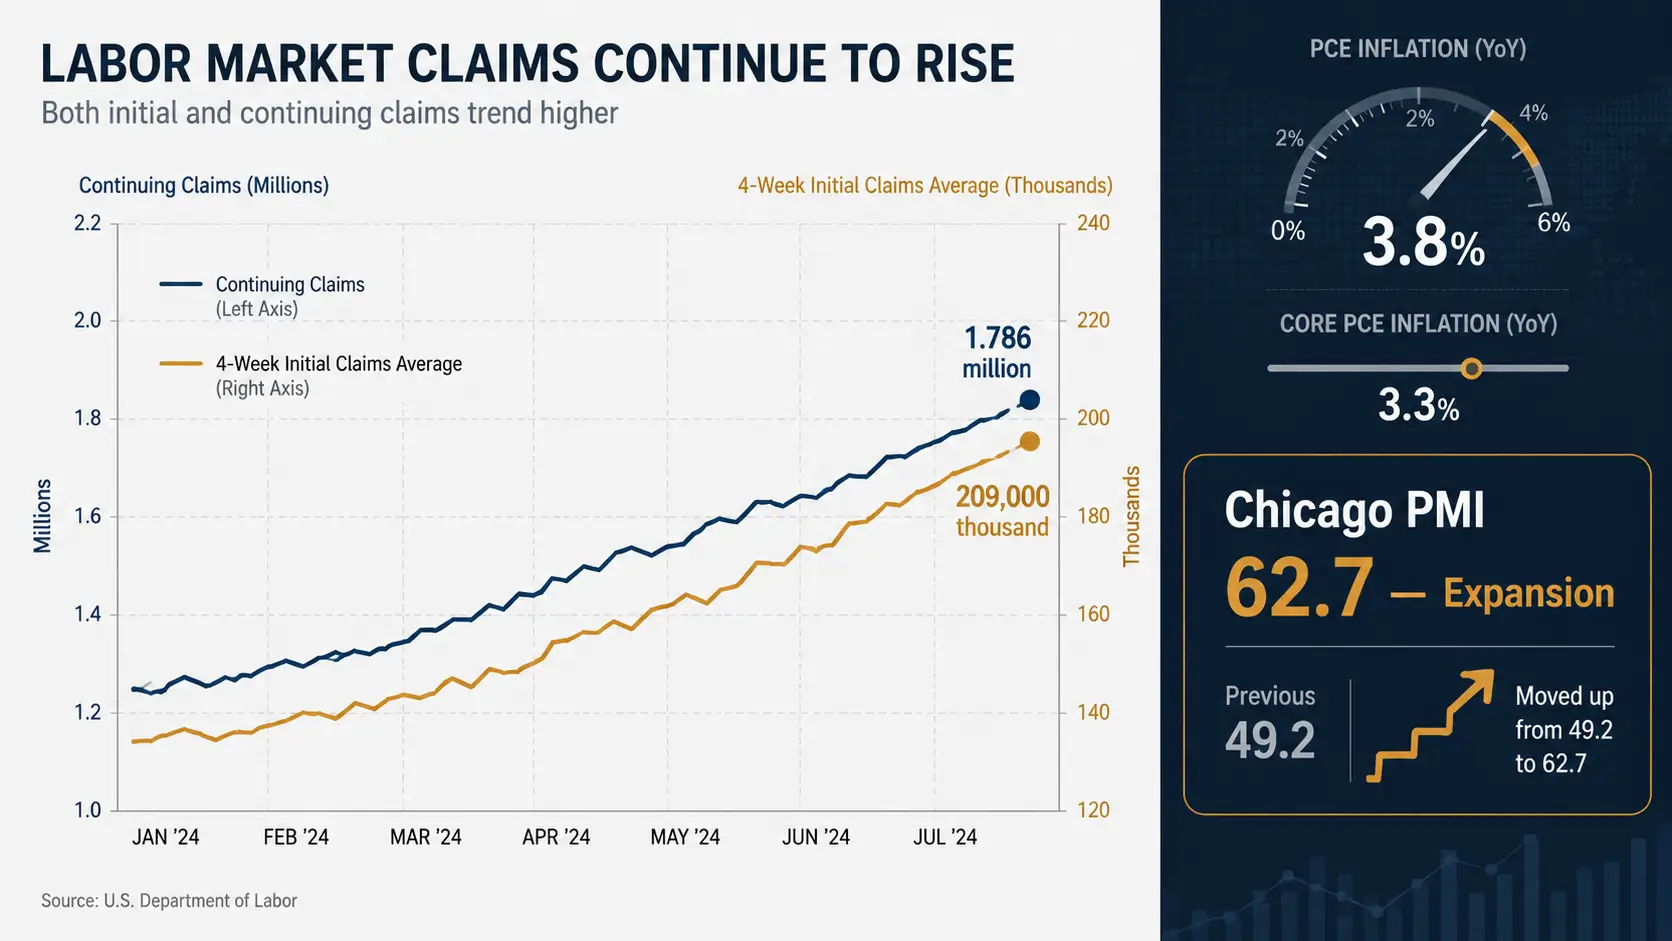
The labor market is softening at the same time. Nonfarm payrolls rose 115,000 in April, with February revised down to a 156,000 loss. The unemployment rate held at 4.3%, but only because the labor force shrank further. Average hourly earnings rose 3.6% year-over-year — below April's 3.8% headline CPI, meaning real wages declined.
The Fed Faces Its Hardest Trade-Off in Decades
At its 04/29/2026 meeting, the Federal Open Market Committee held the policy rate at 3.5%–3.75% but split 8-4, the highest number of dissents since October 1992. Hawks pushed back against any messaging suggesting cuts were imminent. Doves wanted action against slowing growth. At the prior March 18 press conference, Chair Jerome Powell had explicitly rejected the stagflation label, saying, "I always have to point out that was a 1970s term." Two months later, the data make that pushback harder to sustain.
Futures markets have moved decisively. Where traders priced multiple cuts in early 2026, they now assign roughly a 40% probability to a rate hike by December. The 10-year Treasury yield closed at 4.57% on 05/22/2026, up about 24 basis points over the past month, while the 30-year fixed mortgage rate sits at 6.51%. Stagflation risk does not give the Fed a clean answer: easing fuels the inflation problem, holding worsens the growth problem.
Stagflation Watch: The Next 60 Days
The next two months will determine whether stagflation becomes the working diagnosis. Key markers include the May CPI release on 06/10/2026, the May jobs report on 06/05/2026, the second estimate of Q1 GDP, and the June FOMC meeting — where new Summary of Economic Projections will reveal how deeply the committee remains divided. Any de-escalation in the Iran conflict that lowers oil prices would meaningfully ease the inflation tail, but Strait of Hormuz supply disruptions remain the dominant risk to the price path.
For investors, the asymmetry now leans against duration and toward real assets. The risk that the second half of 2026 looks less like a soft landing and more like a stagflation episode has risen materially since March — and the data will keep arriving fast.
FAQ
Is the U.S. economy in a recession as of May 2026?
No. Real GDP grew at a 2.0% annualized rate in Q1 2026 according to the BEA's advance estimate released 04/30/2026, a sharp rebound from Q4 2025's 0.5%. The economy is expanding, though the composition leaned heavily on government spending rather than private consumption.
Why has the narrative shifted from recession to stagflation risk?
Q1 GDP rebounded while April CPI accelerated to 3.8% year-over-year — the highest since May 2023. Gasoline rose 28.4% year-over-year on Iran war supply shocks, and consumer sentiment hit an all-time record low of 44.8 in May 2026. The combination of soft growth, hot inflation, and collapsed confidence is the textbook stagflation setup.
How is the Federal Reserve responding?
The Fed held its policy rate at 3.5%–3.75% at its 04/29/2026 meeting, with four officials dissenting — the most since October 1992. Markets are now pricing roughly a 40% probability of a December rate hike rather than the cuts that had been expected earlier in 2026.
Which sectors are most exposed in a stagflation environment?
Long-duration assets (growth equities, long Treasuries) and consumer discretionary stocks tend to underperform; energy, real assets, and high-quality dividend payers historically hold up better. Households facing stickier prices and slower real wage growth typically pull back on big-ticket spending, weighing on housing and autos.
Sources and Further Reading
- GDP (Advance Estimate), 1st Quarter 2026 — Bureau of Economic Analysis — 04/30/2026 — https://www.bea.gov/news/2026/gdp-advance-estimate-1st-quarter-2026
- Employment Situation Summary, April 2026 — Bureau of Labor Statistics — 05/08/2026 — https://www.bls.gov/news.release/archives/empsit_05082026.htm
- Consumer Sentiment Sinks to Record Low as Cost of Living Concerns Intensify — Advisor Perspectives — 05/22/2026 — https://www.advisorperspectives.com/dshort/updates/2026/05/22/consumer-sentiment-sinks-to-record-low-as-cost-of-living-concerns-intensify