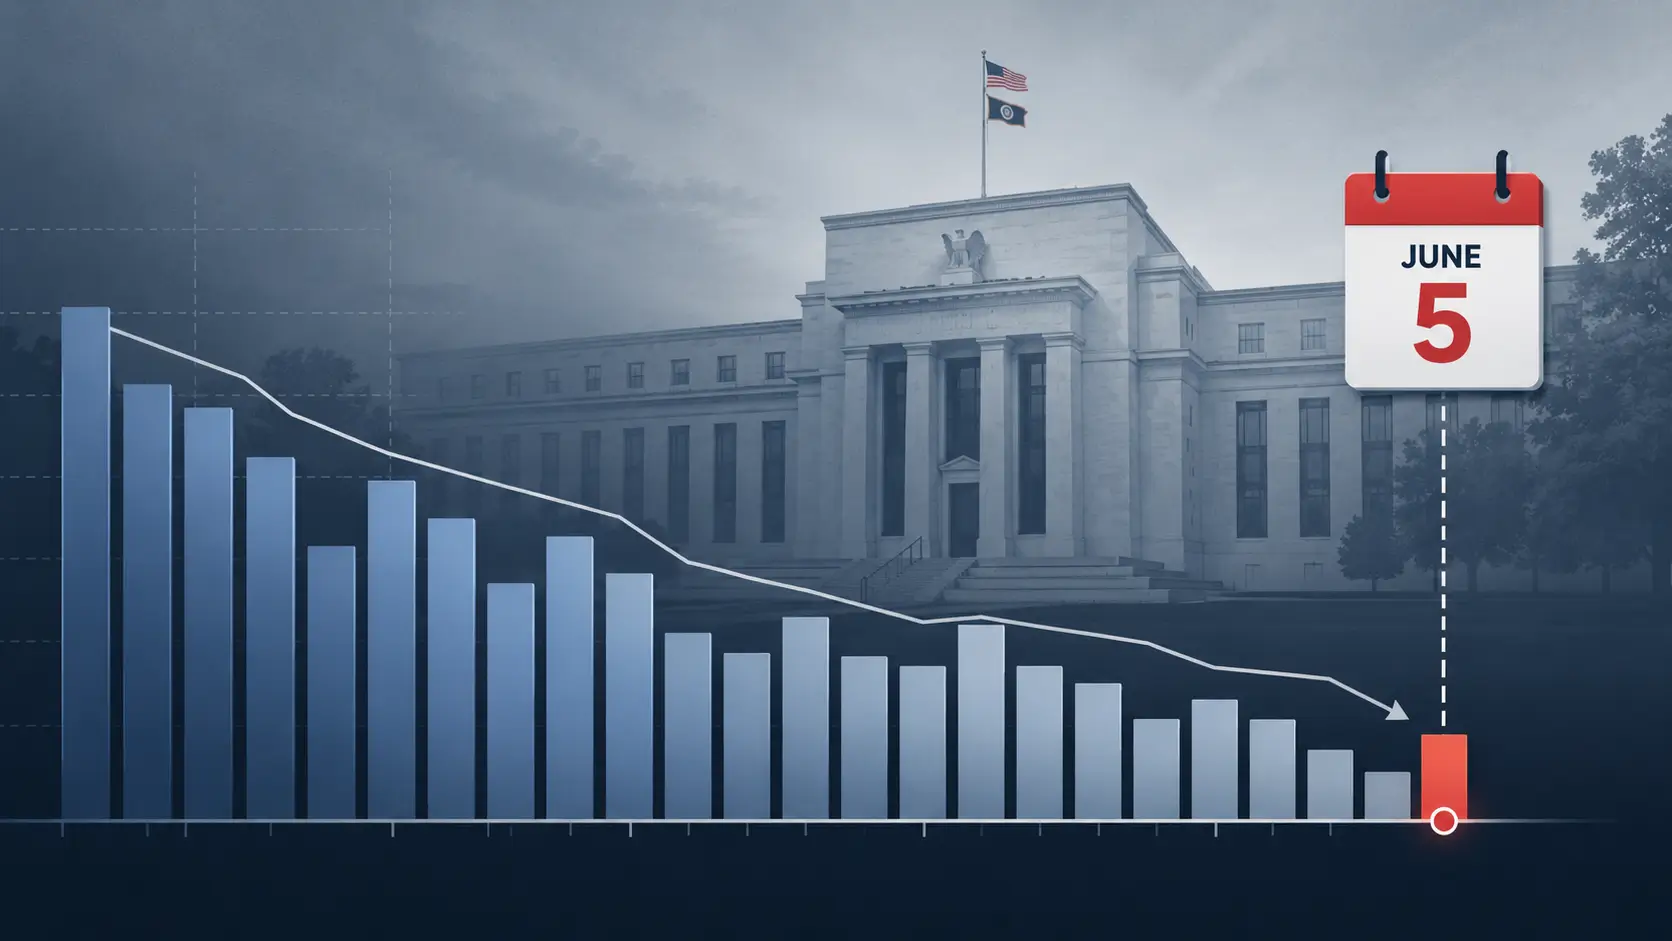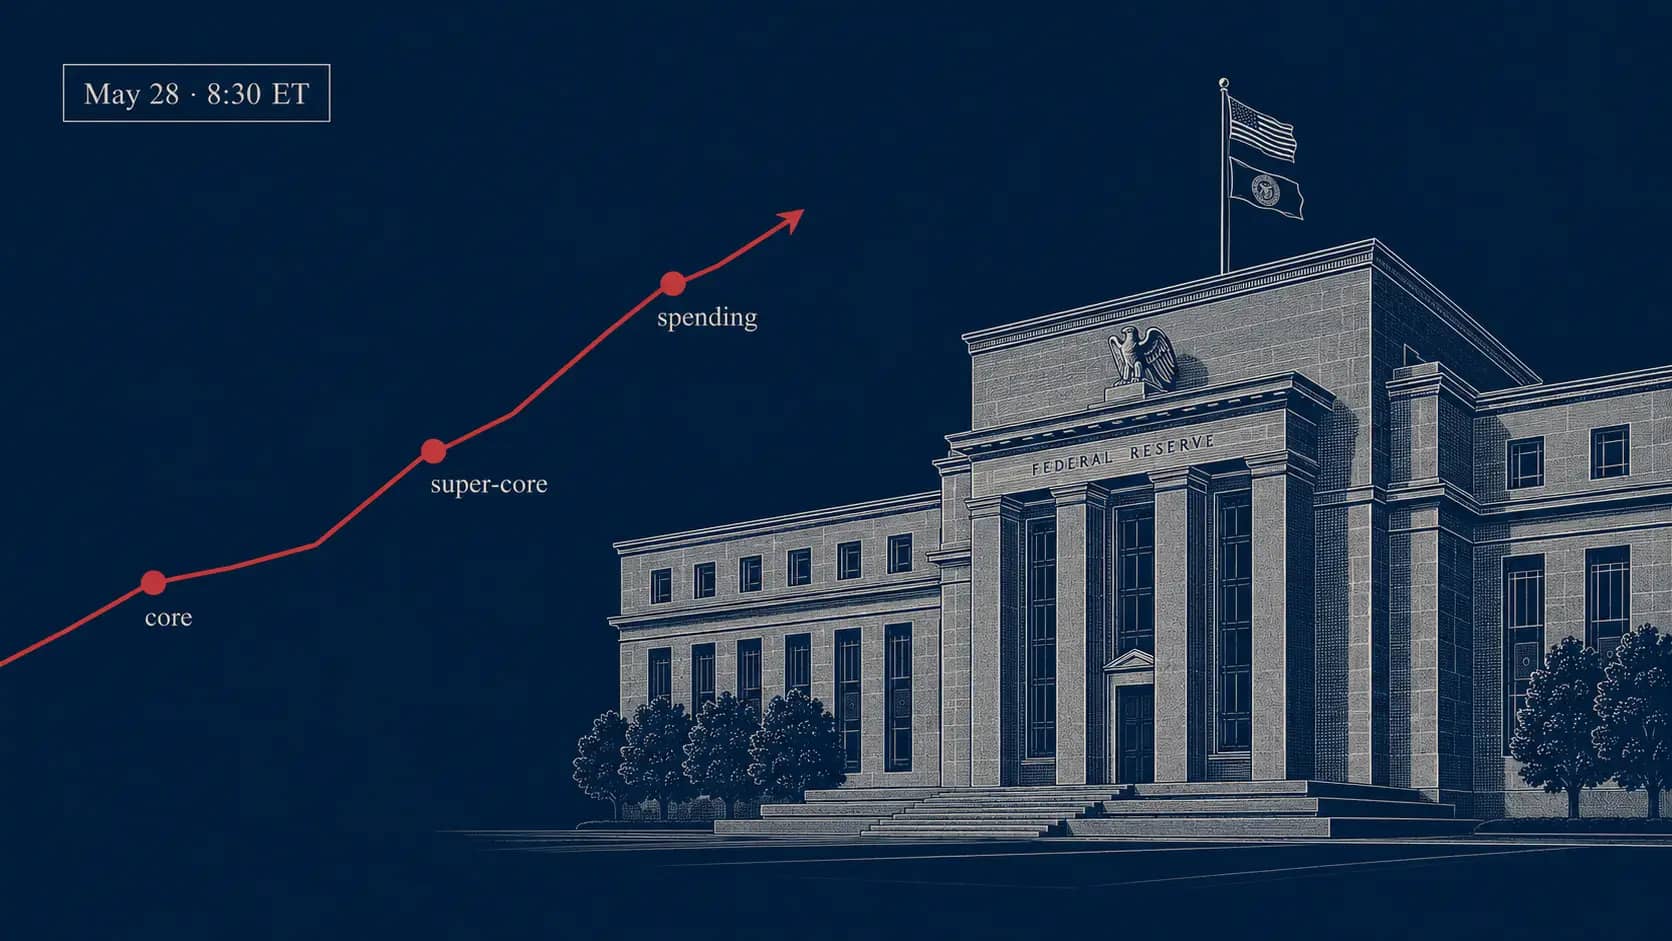
Thursday's April 2026 PCE inflation print could reset the Fed's June meeting path on three numbers. The Bureau of Economic Analysis releases the Personal Income and Outlays report at 8:30 a.m. ET on May 28, alongside the second estimate of Q1 2026 GDP. With prediction markets pricing a 93%-plus hold at the June 16-17 FOMC meeting, this print does not change rates in two weeks — but it can collapse the already-thin probability of any 2026 cut and revive the hike conversation.
Why This April 2026 PCE Print Is Different
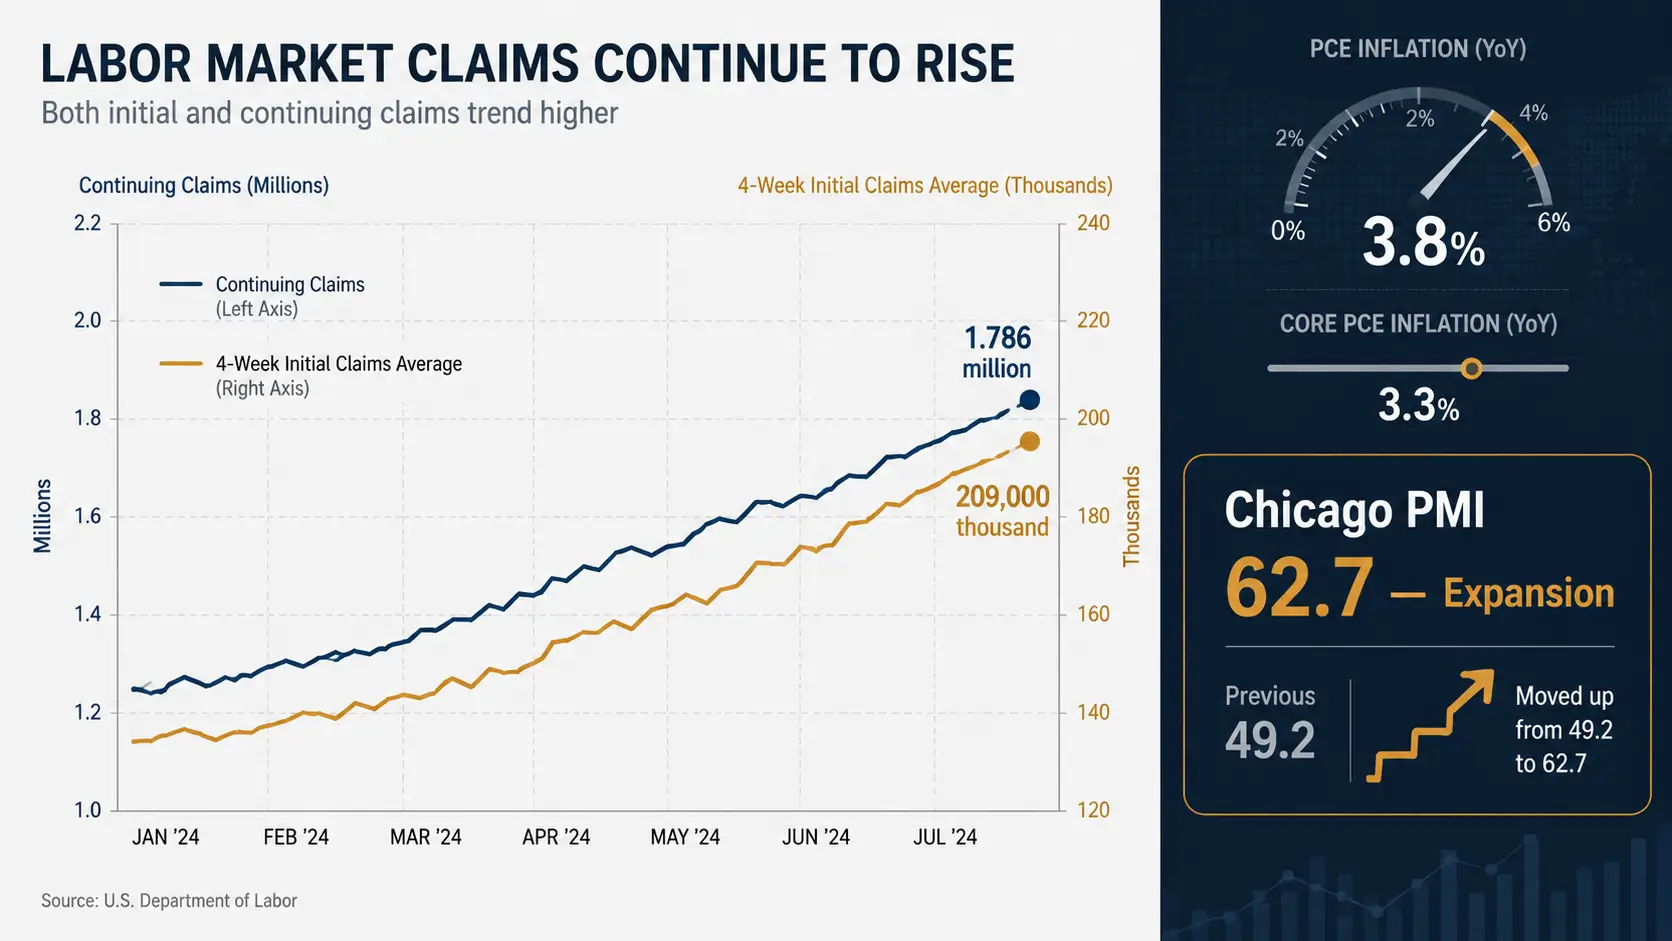
The setup is unusual. April CPI came in at 3.8% year-over-year headline and 2.8% core on May 12, both above consensus and partly driven by a 17.9% annual jump in energy prices tied to the Iran conflict. April PPI then shocked at 1.4% month-over-month on May 13 — the biggest monthly gain since March 2022 — with core PPI up 1.0%. Both readings give economists a clean pipeline into PCE, and both point higher, not lower.
The political backdrop sharpens the signal. Kevin Warsh was sworn in as Fed Chair on May 15 after a 54-45 Senate vote — the closest confirmation in modern history. The May 20 release of minutes from Jerome Powell's final FOMC meeting on April 29 showed a committee fracturing, with more officials open to a rate hike than at the prior meeting. Thursday is the first major inflation read of the Warsh era, and the new chair inherits a hawkish-leaning committee with limited room to soften the message.
Watch No. 1: Core PCE's 3-Month Run Rate
The headline year-over-year core PCE figure is the consensus anchor. March printed at 3.2% — the Fed's preferred inflation gauge sitting 120 basis points above target. But the 3-month annualized run rate matters more for the June decision. March's monthly core PCE ran at a 3.58% annualized pace, the fourth consecutive month of re-accelerating inflation.
If April's monthly print lands at 0.3% or higher — the path implied by April core CPI's 0.4% gain and core PPI's 1.0% surge — the 3-month annualized rate stays above 3.5%. That kills the disinflation narrative that supported the late-2025 cut cycle. It also validates the hawkish bloc identified in our breakdown of the May 20 FOMC minutes and three key dissent signals.
A 0.2% monthly print would soften the optics, but base effects from April 2025 mean the year-over-year rate still likely holds near 3.1%-3.2%. Either way, the gap to the Fed's 2% target widens, not narrows. That alone shifts the conversation from when cuts begin to whether cuts arrive at all.
Watch No. 2: Super-Core, the Fed's Stickiest Concern
Core services ex-housing — "super-core" in Fed parlance — is the metric Chair Warsh and the hawkish bloc watch most closely. It strips out volatile goods and lagging shelter measures, isolating the wage-sensitive services inflation that monetary policy can actually influence.
March super-core ran at 3.44% year-over-year and 4.13% on a monthly annualized basis. Both readings sat well above the roughly 2.6% pace consistent with 2% headline inflation. April CPI's services-less-energy-services component rose 3.3% annually, with transportation services jumping 4.3% — a direct read-through for the PCE super-core measure.
If Thursday's super-core prints at 0.3% MoM or higher, expect Treasury yields to rise across the curve within minutes of release. That would signal services inflation is broadening rather than fading, undercutting the case Warsh made during his Senate confirmation for eventual rate cuts. It also strengthens the argument from Cleveland Fed President Beth Hammack, Minneapolis Fed President Neel Kashkari, and Dallas Fed President Lorie Logan that a premature cut could re-anchor inflation expectations above target.
Watch No. 3: Income vs. Spending — and the Path to June
March personal income rose 0.6% ($149.2 billion) while personal spending jumped 0.9% ($195.4 billion) — the savings rate compressed accordingly. That gap signals consumer resilience but also vulnerability: spending outpacing income depends on either savings drawdown or credit, neither sustainable indefinitely.
Thursday's split matters for the Fed's growth-vs-inflation balance. A repeat of strong spending alongside softer income hands the hawks more ammunition — the consumer is still absorbing higher prices rather than pulling back. A reversal, with spending decelerating and savings rebuilding, would be the first concrete sign of demand fatigue under restrictive rates.
Markets currently assign 66% probability to zero rate cuts in 2026 and just 18.5% to a single 25-basis-point cut, per Polymarket pricing in late May. JPMorgan and Goldman Sachs have already delayed or eliminated their 2026 easing forecasts. A hot Thursday print compresses those cut odds further; a soft print is the only scenario that revives them. Equities have rallied through May on the assumption that the cut-or-hold debate is settled — a hawkish surprise breaks that calm. For investors weighing positioning, the broader 2026 rate cut outlook depends on whether services inflation breaks lower in the next two prints — and Thursday is the first test under the Warsh Fed.
Frequently Asked Questions
When does the April 2026 PCE inflation report release? The Bureau of Economic Analysis releases the April Personal Income and Outlays report — which includes the PCE price index — at 8:30 a.m. ET on Thursday, May 28, 2026, alongside the second estimate of Q1 2026 GDP.
What was the most recent core PCE reading? Core PCE rose 3.2% year-over-year in March 2026 and 0.3% month-over-month, per the BEA release on April 30, 2026. That figure sits 120 basis points above the Fed's 2% target.
What is "super-core" inflation, and why does the Fed watch it? Super-core refers to core PCE services excluding housing. It strips out volatile goods and lagging shelter measures, isolating the wage-sensitive services inflation most responsive to monetary policy. March super-core ran at 3.44% year-over-year.
Will the Fed cut rates at the June 16-17 meeting? Prediction markets currently price a 93%-plus probability the Fed holds the federal funds target at 3.50%-3.75% in June. Polymarket assigns 66% odds to zero cuts across all of 2026 and 18.5% to a single 25-basis-point cut.
Sources and Further Reading
- Personal Income and Outlays, March 2026 — U.S. Bureau of Economic Analysis — 04/30/2026 — https://www.bea.gov/news/2026/personal-income-and-outlays-march-2026
- CPI inflation April 2026: Prices rose 3.8% annually — CNBC — 05/12/2026 — https://www.cnbc.com/2026/05/12/cpi-inflation-april-2026-.html
- Fed minutes show more policymakers were prepared to lay groundwork for rate hike — BNN Bloomberg / Reuters — 05/20/2026 — https://www.bnnbloomberg.ca/business/2026/05/20/fed-minutes-show-more-policymakers-were-prepared-to-lay-groundwork-for-rate-hike/